The most important part of analyzing data is to define an objective. This is often overlooked. Analysts tend to drill down for insights without really knowing what they are looking for. Dashboards can show metrics without explaining what they mean.
In this post, I’ll explain how to get the most from analyzing data, such as sales and profit.
What Is the Trend?
Trend analysis is a simple line or bar graph that shows historical data. How to interpret the results depends on the questions. Assume, for example, the question is, “Are sales growing?” To determine the answer, we could calculate year-over-year changes in sales.
Percentage Change in Sales = (Total Sales This Year – Total Sales Last Year) / (Total Sales Last Year)
In the example data below, the answer would be yes, sales are growing by 3.84 percent in 2018 ($13,500 in sales) compared to 2017 ($13,000). This is a basic analysis with a quick, simple answer.
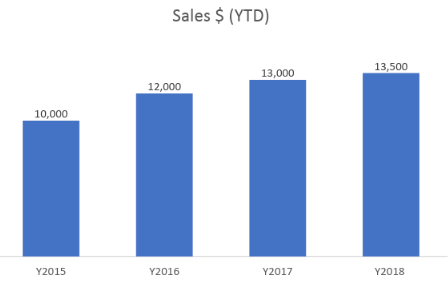
This simple bar chart shows 2018 sales revenue ($13,500) has increased by 3.84 percent over 2017 ($13,000).
A more advanced analysis is to look at the rate of growth by calculating year-over-year rates for previous periods. When we do that, we realize that the growth is slowing — it was higher in 2016 (20 percent), lower in 2017 (8.33 percent), and lower again in 2018 (3.84 percent).
Analyzing historical sales is a good way to predict future amounts. Microsoft Excel’s TREND function can do this. You could also simply look at sales changes from previous periods and calculate it on your own.
For more precise results, add scenarios specific to your business. For example, sales could increase by 5 percent from running marketing campaigns for Black Friday.
Benchmarking
Benchmarking is a technique to compare your company to competitors, your overall industry, or even your own historical results. A popular benchmark is the Net Promoter Score.
NPS is a measurement of how likely your clients are to recommend your business. The data is collected by asking customers a single question: “How likely would you recommend our [company, product, or service] to a friend or colleague?” Respondents provide one number: 0 to 10 with 10 being the highest. Respondents answering 0 to 6 are called “Detractors”; 7 to 8 are “Passives”; and 9 to 10 are “Promoters.” Once you have the percentage of promoters and detractors, you can calculate NPS.
NPS = % of Promoters – % of Detractors
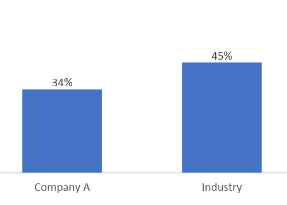
Company A has a 34 percent NPS while the industry average is 45 percent.
You can use the NPS data to answer the question “How do we compare to our overall industry?” Based on the data above, Company A is below the industry average. This is simple benchmarking.
Once you know that you are better or worse than another company, or the industry overall, you can dive deeper into the data to understand the reason. The objective would be clear: Why are Detractors unhappy? You could investigate their demographics, what they ordered, the name of their sales customer service rep, and so on.
Customer Reviews
Customer reviews can provide more insights than you might think. Since they have taken the time to leave a review, these customers can indicate what is working and what is not. It could provide a base for an analysis.
For example, if a customer wrote, “Horrible customer service. Had to wait forever to get someone to pick up.” Your job could be, for example, to pull up call volumes and response times throughout the day to determine staffing levels.
Price vs. Volume
Merchants frequently wonder if reducing prices will increase sales volume? To answer that question, use a simple price-elasticity calculation, which measures the demand for a product when the price changes. Test various price points to generate data on how it impacts sales. Here is the calculation.
Elasticity = (Change in Quantity / Baseline Quantity) / (Change in Price / Baseline Price)
If the result is negative, an increase in price will decrease the demand. If the result is positive, any change in price will not affect demand — it is inelastic. Depending on how much data you have, you can optimize a product’s price to maximize total revenue.
Cause and Effect
Often merchants want to access correlation, such as if sales are correlated to overall industry sales of a product or commodity. Or if there is a correlation between marketing expenditures and overall sales volume. To do this, run a simple coefficient of correlation using the Excel CORREL function. The results will fall between -1 and 1. If it’s 0 or close to 0, there is no correlation.
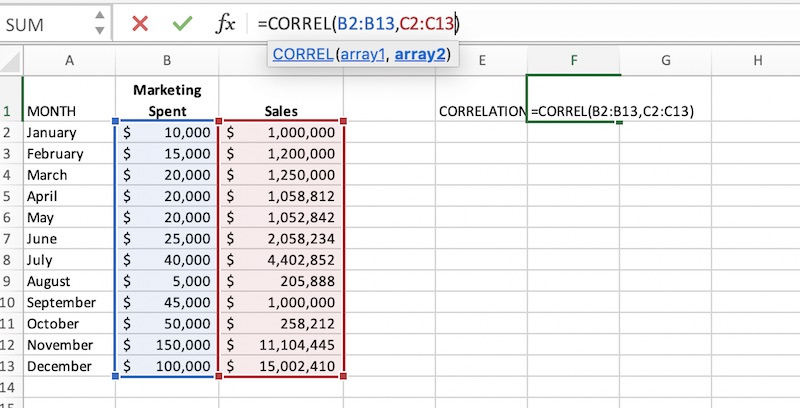
This sample Excel CORREL function adds total 12-month marketing expenditures and 12-month revenue. It then correlates the two to determine if one affects the other. In this case, the correlation is high: .85. Increases in marketing spend increase sales.
A coefficient of correlation can answer if A is correlated to B, but no more. To understand what is driving sales, you would likely need a more sophisticated analysis, such as regression modeling. To interpret the results of a regression model, look at which variables have the biggest impact on sales.
Form Questions
The point is to form questions before analyzing data. It is near useless to say 30 percent of sales came from paid search while 40 percent came from returning customers. What is more meaningful is to discern that a 30-percent increase in pay-per-click advertising increased sales by 20 percent or that we have more returning customers than last year due to improvements in customer service.