
Facebook continues to grow every year since it launched in 2004, in both active users and time spent on the platform. It’s still the most used social platform with nearly 2.45 billion monthly active users. Knowing who’s using the platform and how they are using it can make a difference when crafting a Facebook marketing strategy.
Because the platform changes and evolves so frequently, staying on top of statistics like demographics, usage, and other platform trends, is key. Here are important Facebook stats and figures you should know when creating your 2020 strategy for the platform.
Facebook demographics
It might seem like everyone is using Facebook, but knowing particular social media demographics for a platform can give you insights into the type of people using it the most. Here are key user demographics for the average Facebook user in 2020.
1. Users 65 years and older are the fastest-growing group on Facebook
In 2019, the most significant change in Facebook user demographics was among users born in 1945 or earlier, aka the “Silent” generation. This age group had grown on the platform from 26% in 2018 to nearly 40% in 2019. Interestingly, Millennials and Boomers only increased by a maximum of 2% and Gen Xers even reduced their Facebook use.
2. Fewer teens are using Facebook now than in previous years

In 2015, 71% of teens were active on Facebook. Currently, only 51% of American teenagers between 13 and 17 years old, use Facebook. While it’s still more than half of US teenagers, keep this data in mind when creating targeting ads and content.
3. Only 10% of Facebook users live in the US or Canada
Even though Asian-Pacific users comprise nearly 41.3% of monthly active users (MAU) on Facebook, Us and Canada’s 10.1% MAUs shouldn’t be dismissed so quickly. Just over 48% of Facebook Ad revenue comes from the United States and Canada alone. Businesses with an international presence, or serve international audiences, have a tremendous opportunity to reach ad markets with lower competition than North American markets.

4. 74% of Facebook users are high-income earners
Facebook use is prominent among high-earners, and even surpasses LinkedIn, which reaches just 49% of users making more than $75,000. YouTube is the only social media platform with more reach at 83% of high-income earners.

Facebook usage statistics
Knowing who is using the platform is step one. The next step is knowing how these users are engaging with Facebook.
5. 1.62 billion users visit Facebook daily.
While it might seem like there’s an urge to use social media less, the data shows otherwise. Facebook’s overall active users continue to increase every year across the platform as a whole. Among active US Facebook users, 74% of people use the site every day.
6. 88% of Facebook users are on the platform to stay in contact with friends and family
Where you once had to make long-distance calls to keep in touch with friends and family, you’re now only a click away from maintaining better relationships. According to Statista, Facebook is a platform all demographics use to stay in touch.

7. Highest traffic occurs mid-day Wednesday and Thursday
The days and times you post on social media can impact the engagement on your posts. Our report on the best times to post on every social media platform found that between 11 a.m. and 2 p.m. on Wednesday and Thursday are the best time to post on Facebook to reach the most people.

Of course, depending on your audience and industry, your highest engagement times might differ slightly. Testing when your audience is most engaged can help you create a social media content calendar that shares posts at the optimal times on each platform.
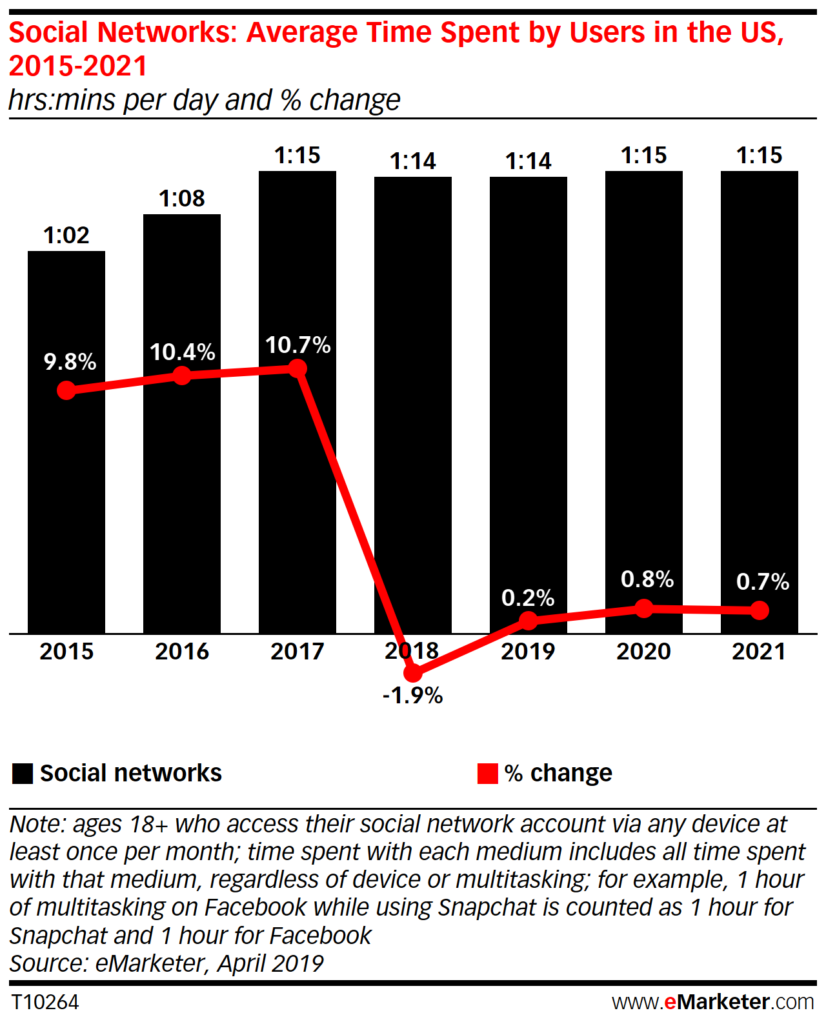
8. In 2020, the average daily time on Facebook will remain flat
Last year, an eMarteter study found that daily social media use was decreasing. Facebook use, specifically among US users 18 and up, decreased by nearly 2% compared to previous years. In 2020, they forecast that the average daily time will essentially remain the same.
9. Facebook Stories has 300 million active users daily
While Instagram Stories is slightly more popular, Facebook Stories proves to grow as a place where Facebook users spend a lot of time. Creating Facebook Stories requires a different marketing strategy than creating other types of Facebook posts. If your audience is active on Stories, it’s worth it to invest in creating content tailored to that medium.
10. 53% of adults on Facebook don’t understand how their newsfeed displays posts
Older Facebook users have less of an understanding of how Facebook chooses which posts to show in their news feed. Whereas 59% of users 18-29 years old say they have a pretty good understanding of how the Facebook algorithm works, only about 38% of users over 50 understand why they see certain posts.

Use evergreen messaging that adds context to the reason target demographics see ads or posts helps brands be more transparent and avoid audience confusion.
Facebook Ad Statistics
Facebook is known for releasing quarterly earnings reports, which can be a gold mine of value for marketers who rely on Facebook Ads. As Facebook continues to make most of its revenue from advertising, the advertising landscape will become more competitive. But this also means that Facebook will likely keep and improving it’s advertising process to encourage continued use.
Here are Facebook Ad statistics that will help you when creating new campaigns this year.
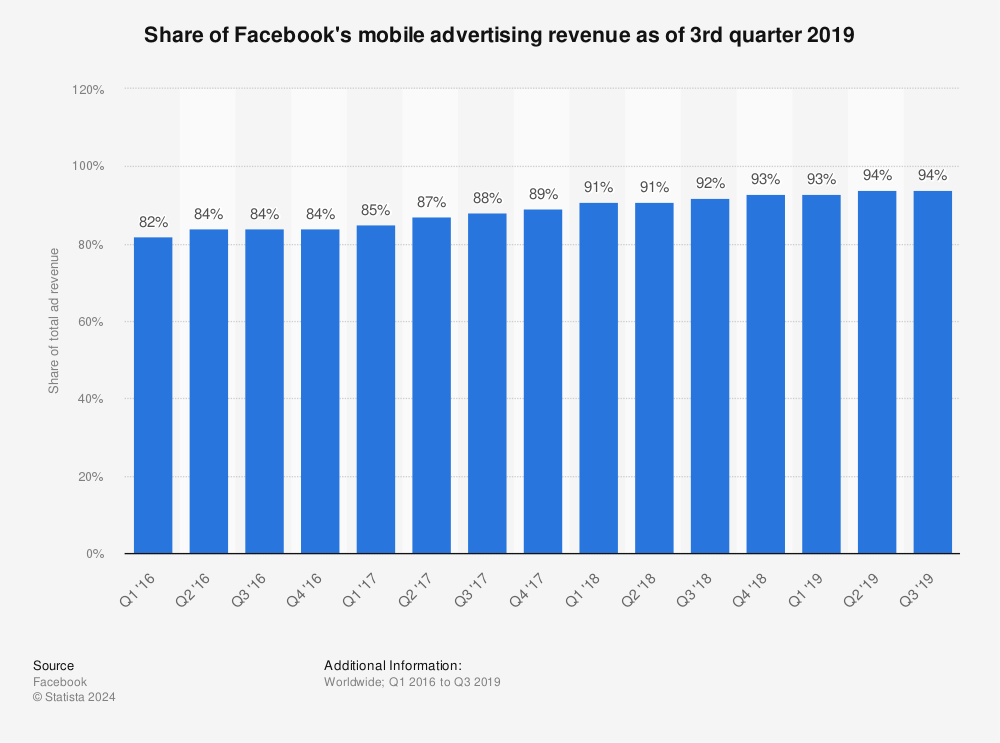
11. 94% of Facebook Ad revenue is from mobile
A mere 6% of Facebook’s advertising revenue comes from desktop-only users. People continue to access Facebook primarily from mobile, which drives advertisers to spend more money targeting mobile users. This information also serves as a reminder of how important it is to optimize all of your social media content to be as mobile-friendly as possible.
12. The average price for Facebook Ads decreased 6% in 2019
This might come as a surprise considering how competitive Facebook Ads are becoming. But, with a 37% increase in ad impressions, this is good news for marketers who want to get the most out of their ad dollars in 2020. Facebook attributes the decrease in ad prices to a mix of Stories and geographies ad targeting, so this might signal even lower ad costs in the future.
13. The average cost per click for a Facebook Ad is $1.72
A study by Wordstream calculated the average cost per click (CPC) for a Facebook Ad across all industries and found $1.72 to be the benchmark number. Knowing the cost per click can help you understand how much you might need to spend on Facebook Ads to get a good ROI.

CPC varies across industries and audiences, so it’s important to test your own ads to determine an average CPC for your business.
14. Overall Facebook Ad impressions increased 37% in 2019
Reach on Facebook is as high as ever. With impressions rising, and ad prices dropping, it just reinforces that now is a great time to focus marketing energy on the platform. According to Facebook CFO David Wehner, the spike in ad impressions is a result of ads on Facebook Stories, Instagram Stories and Facebook Newsfeed ads.
Facebook video stats
Videos are becoming increasingly popular post types, accounting for about 11% of Facebook posts. So if you haven’t thought about how to incorporate an engaging video strategy into your Facebook marketing plan, it’s time to consider it. Between video ads, video posts, stories and live streams, Facebook videos garner up to 8 billion views per day.
Here’s what you need to know about the future of Facebook videos.
15. Mobile-friendly video generates higher engagement.
Mobile-first video ads make up more than half of Facebook’s video revenue and it makes sense why. As more users opt to access Facebook from a mobile device, advertisers need to shift their strategies to accommodate that which means creating videos specifically designed for mobile.
16. Users watch 85% of Facebook videos without sound
Facebook users still prefer to scroll in silence. Many Facebook videos begin playing without sound, making it extremely important to focus on imagery that catches the viewer’s attention. If there’s dialogue or narration in your videos, adding captions makes it more accessible and increase engagement.
This robotic kitchen has dinner covered.
Posted by Mashable on Saturday, September 24, 2016
This Facebook video from Mashable is a great example of how to seamlessly integrate captions into the video despite it not having any audible narration. They’ve adapted their video strategy to accommodate the desire of watching videos without sound.
17. Facebook users are 4x more likely to watch live streams than recorded videos
The time people spend watching Facebook Live has quadrupled in the past year. Marketers have noticed that Live videos perform better with Facebook’s algorithm and generate more engagement than pre-recorded videos.
18. Square Facebook videos get 35% more views than landscape videos
A case study by Buffer found that square videos outperformed landscape videos in both Likes and engagement.
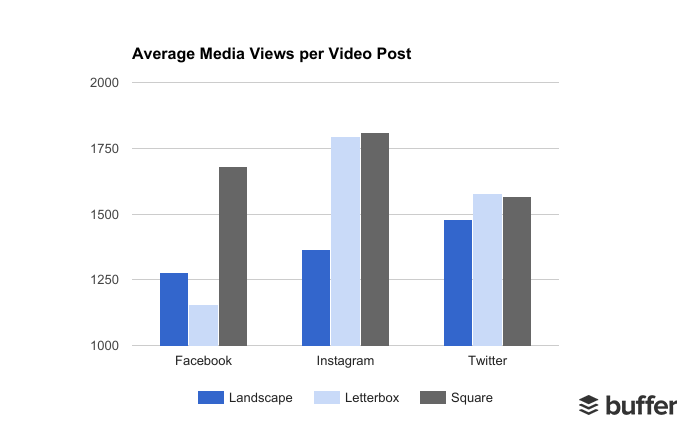
The study also found that it costs 7.5% less to get someone on Facebook to engage with square video than a rectangular video on both mobile and desktop. Facebook themselves encourage users to create videos in a format that is unique to mobile to increase engagement.
Conclusion
A major theme this year is the continued growth of Facebook Ads and the emphasis of video on the platform. Knowing Facebook statistics and trends can help you forecast possible shifts on the platform, and modify your Facebook marketing strategy so that you can increase engagement, reach your audience and meet your goals.
How will these statistics shape your 2020 Facebook marketing strategy? Let us know in the comments or by talk to us on Twitter.