Great new visual design and usability, but no long-term data (yet)
There has been a fair bit of excitement about the new search console (GSC) since it was first announced, perhaps mainly since it was promised this would give us access to a full 16 months data about search queries to our site rather than the previous 90 days.
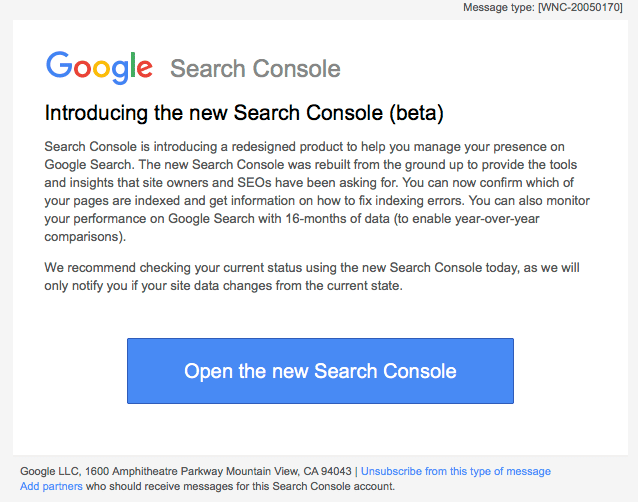
Last week took a look, prompted by the many reminders to take a look a the new beta since I asked to join the beta a few months back. Google announced the beta was available earlier in January and it seems most admins will be getting alerts, but if you haven’t you can read about the benefits here and see Google’s summary of the new search console features.
I was also interested to see whether there would be any new reports or insights which were available. I’m a fairly heavy user of search console and as I explain in our members’ Quick Win: 3 Killer techniques to improve SEO one of its most powerful features for optimising skyscraper or cornerstone content is to review an individual page to see which search terms its currently attracting data for, so you can encourage more of the same or look at new opportunities. The thing is this technique was far from obvious in the old GSC.
My impressions?
Visual design
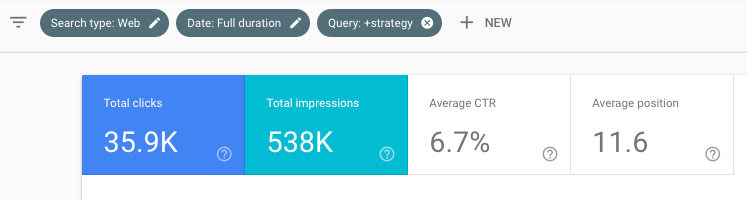
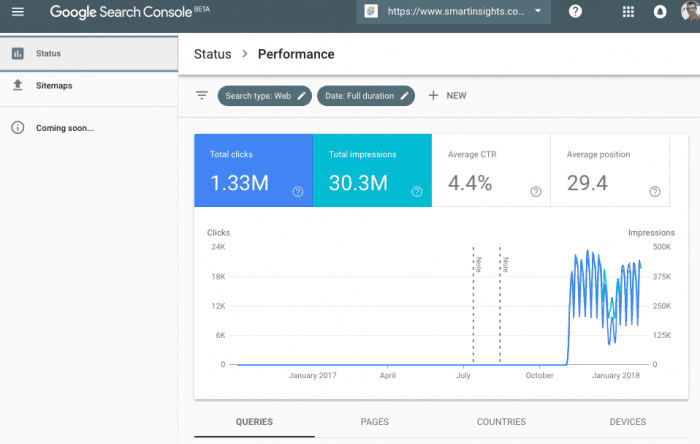
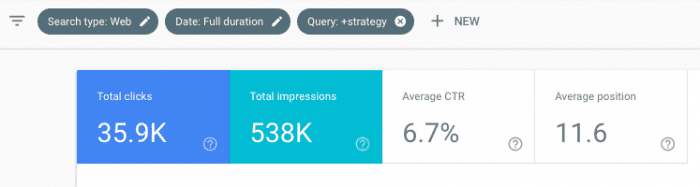
The first impressions are positive thanks to the prominence of the headline figures as shown below.
Usability
More importantly, this is also much improved. It’s clearer how you switch between queries, landing pages, countries and devices based on the 4 tabs below the chart. It’s also much easier to filter keywords attracting visits to a page or section as I mentioned above. You do this by using the filter above the chart to add a page to analyze. You can also easily add keywords to filter by. For example, if I want to see which keywords/pages are working best related to strategy, you simply add it via + New.
 Data available
 Data available
One of the first things I was looking for was the 12 to 16 months worth of historical data – useful for year-on-year comparisons which we currently do in the Google Sheets / Analytics API as explained in our Quick Win on auditing content marketing.
As you will have noticed from the charts above we still only have c 90 days. So either this feature hasn’t been switched on yet, or we will have to wait for the data to build up – I hope its the former.
So that’s my first impressions, please let me know yours or what I may have missed through social!
There’s clearly more to come judging by the big gap with Coming Soon, but first impressions are great.
You can read more on interpreting the report in Google’s Help system on The Performance report.