Although online shopping is on the rise, more than 90% of smartphone owners visit brick-and-mortar stores at least once a week, according to a report released by Euclid Analytics.
The survey includes responses from approximately 1,500 US consumers, and some of the results are compiled into an infographic.
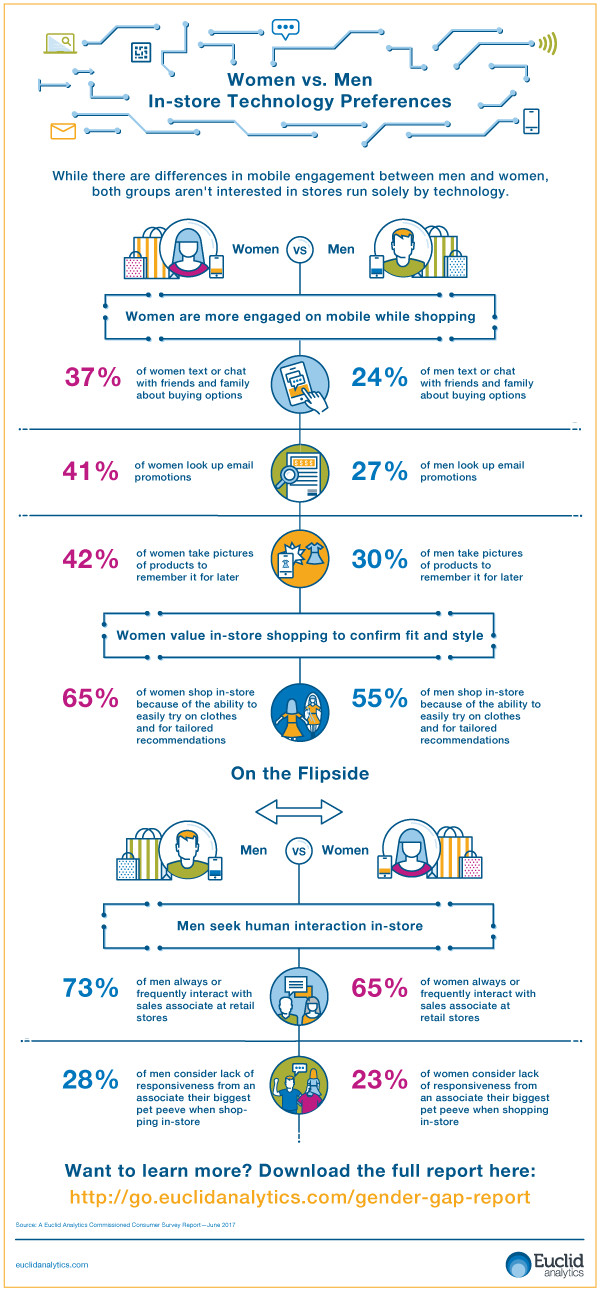
The findings include the following:
• Women value in-store shopping to confirm fit and style: Some 65% of women (vs. 55% of men) shop in-store because of the ability to easily try on clothes and for tailored recommendations.
• Men seek human interaction in-store: Nearly three quarters (73%) of men always or frequently interact with sales associate at retail stores, versus 65% of women. Some 28% of men consider lack of responsiveness from an associate their biggest in-store pet peeve (versus 23% of women).
• Men and women are not ready for a full on AmazonGo shopping experience. Less than half of each group is interested in visiting a purely technology-operated store.
To see more from the report and learn how men and women use technology in their in-store experiences, check out the infographic:

Laura Forer is the manager of MarketingProfs: Made to Order, Original Content Services, which helps clients generate leads, drive site traffic, and build their brands through useful, well-designed content.
LinkedIn: Laura Forer