
A lot of Facebook marketers fall into one of two categories. Either you spend too much time on reporting, or not enough. Whichever bucket you fall in, a good way to find a middle ground is with a Facebook dashboard.
The challenge with Facebook’s native analytics is the amount of data you’re given all at once is a tad overwhelming. The information overload makes it difficult to figure out where to start and how to quickly explain whether or not your efforts are paying off.
While having a bunch of unique data is nice, sometimes you just want to understand what’s going on at a high level view. And that’s why having a Facebook dashboard can really pay off. In this guide, we’re going to explore some of the most important pieces of a good Facebook dashboard, and show you the best option to build your own.
The Purpose of a Facebook Dashboard
Before we dive into the nitty gritty, let’s take a step back and describe the purpose of a Facebook dashboard.
Dashboards give you a high level view of your Facebook analytics. Think of it like the home page of a website. The home page is the “center” and users can navigate to other pages from there depending on what they want to find.
Your Facebook dashboard is the center of your analytics, and you can drill down into specific metrics from there.
Essentially, your dashboard gives you a snapshot of your Facebook page performance.
Now that you know what’s a Facebook dashboard, the next question is what should it include?
Analyze Your Audience
First and foremost, you need to know who you’re speaking to. What is the demographic makeup of your Facebook fans? Knowing their age, location and other insights will allow you to cater your content and messaging to their needs.
You don’t need to do a deep dive into your audience every day, since it shouldn’t change too drastically on a frequent basis. But you should at least have a grasp of the general makeup of your Facebook fans at any given time.
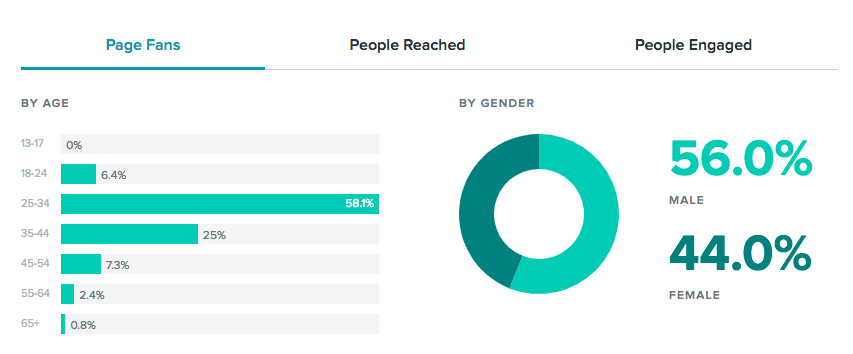
The cool thing about Sprout Social’s powerful Facebook analytic tools is we break your audience down by total fans, people reached and people engaged. Sometimes you’ll find that these three groups aren’t the same.
For instance, a majority of your total page fans might be from San Francisco in the 18-24 age group. But the demographics of the people that actually engage with your page might be 18-24 year olds from New York. With that information, you can:
- Try to attract more of the types of users who engage.
- Share content that caters more to the people that aren’t engaging.
Monitor Your Publishing Behavior
With the decreased organic engagement on Facebook, publishing frequency and timing have become more important. Sharing content when your audience is most likely to see it is a quick and easy way to boost your chances of getting engagement.
We’ve looked at the best time to post on Facebook, and found that the most engagement tends to happen around the afternoon.

However, that’s a general guideline. Your brand’s optimal time might be in the morning or late at night. That’s why it’s extremely helpful to track your publishing behavior in your Facebook dashboard.
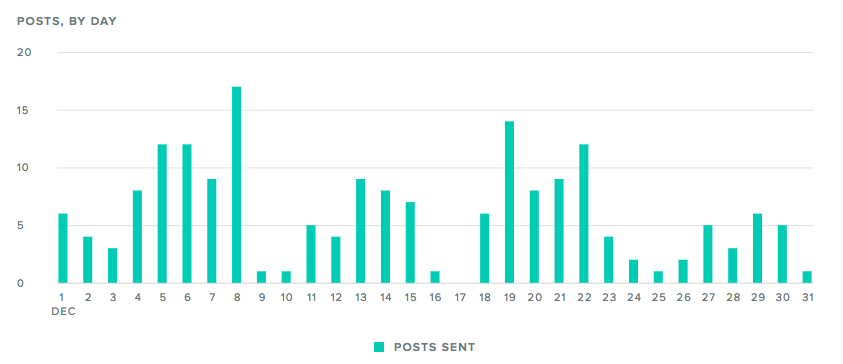
What days do you post most often? How many times do you post per day on average?
Of course, answering these questions will only paint half the picture.
The other half is comparing your publishing behavior against your engagement on each of those days. Do you get more comments and likes when you post three times per day instead of once? Is there a correlation between the date you publish and the number of impressions?
Your Facebook dashboard can shed light on all these questions so you can make better decisions about when and how often to share on Facebook. But like we mentioned, publishing behavior data is best when paired with engagement stats. Which brings us to the next point.
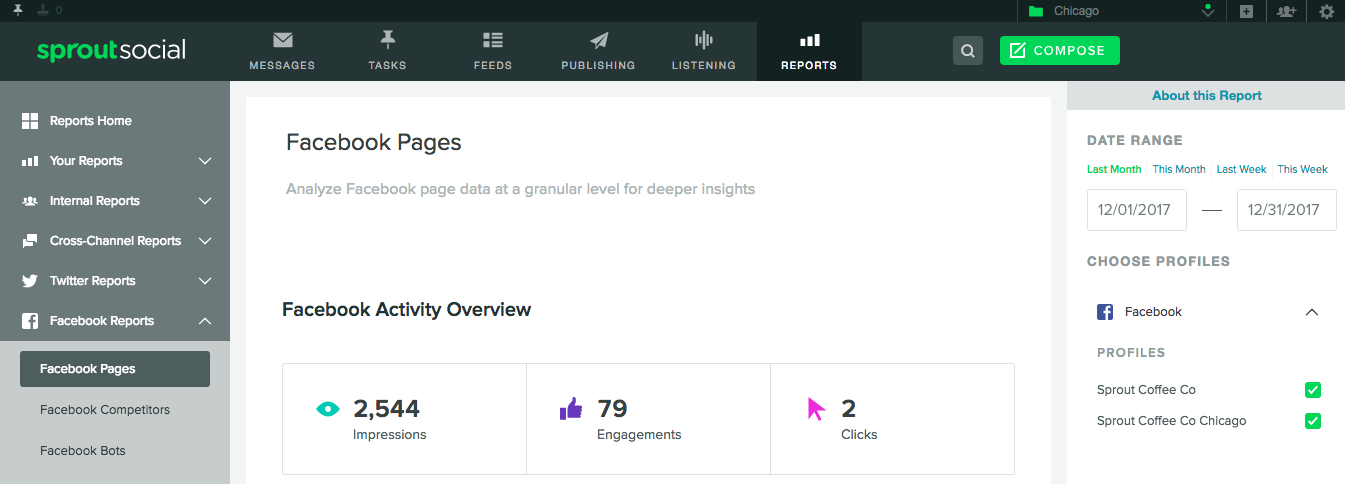
Measure Engagement & Impressions
This is probably going to be where a lot of your focus and attention goes in your Facebook dashboard. While organic engagement on Facebook has decreased for brands, that doesn’t mean you should stop tracking it. In fact, it’s the exact opposite.
It’s even more crucial to measure which posts drive the most engagement for your brand so you can try to replicate or amplify the results.
Use your Facebook dashboard to track:
- Total engagement and impressions
- Increases or decreases in engagement and impressions
- Posts with the most engagement and impressions
Let’s start with engagement. Track your engagement per day and look for trends. Is engagement higher on certain days of the week? Has engagement decreased week over week? Also, don’t forget to compare your engagement numbers with your publishing behavior. This will help you understand whether or not posting more frequently leads to more engagement.
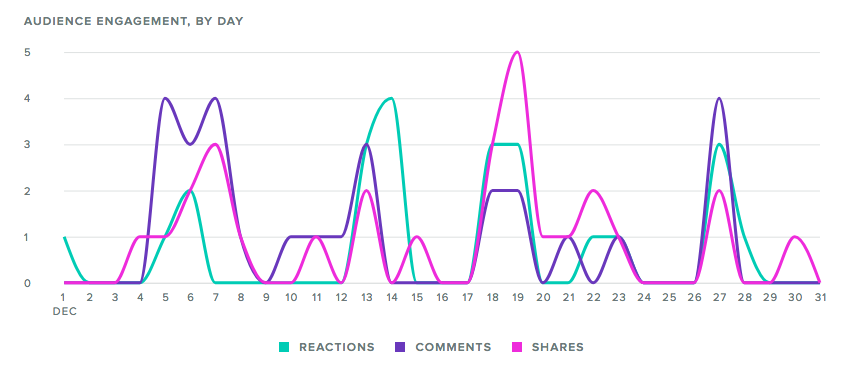
On top of that, it’s also important to monitor how people engage with your content. Are they sharing, liking or commenting?
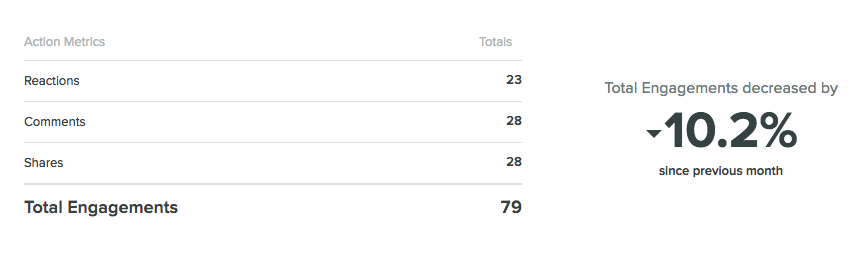
Knowing this breakdown gives you an idea of how invested peopled are into the content you share. If Facebook engagement actions were a totem poll, reactions would be at the bottom and comments would be at the top.
Leaving a reaction is simple and takes less than a second. A comment on the other hand means the person looked at your content and was compelled to speak up about it. Shares are up there with comments because it means people are sharing your content with their friends. And that extra exposure can drive up your engagement and expand your audience.
Next, is impressions. Just because you have thousands of fans doesn’t mean they all see your posts. Impressions will show you how many eyeballs are on your content.

With Sprout, your impressions are broken down into three different categories:
- Organic: The number of times any organic content associated with your Page was seen in News Feed, ticker, or on visits to your Page.
- Paid: The number of impressions of Sponsored Stories or Ads pointing to your Page.
- Viral: The number of times any organic content associated with your Page was shared by third parties, and subsequently generated impressions of your Page.
Try comparing the three against each other. A high number of viral impressions is a good indication that people are sharing your content and not just looking at it. And with the changes to the Facebook Newsfeed, you might notice your paid impressions start to outpace organic if you’re running ads or sponsored stories.
Track Video Performance
Facebook gets over 8 billion average video views every day. Needless to say, it’s well worth your time to put resources toward Facebook video. Not to mention, all indications are video will continue to be a dominant force across all mediums and channels, not just Facebook.
But just like any other type of content, you need to track and monitor your video performance on Facebook. Otherwise, you could end up throwing a ton of money down the drain on poor performing videos.

Pay attention to how many views you’re getting, and your ratio of full to partial video views. Are the majority of people only watching part of your videos? If so, think about ways you can get people to watch through to the end. Maybe you can make shorter videos or change the flow to keep people compelled throughout the entire video.
Use your Facebook dashboard as the starting point to dig deeper into your video efforts.
Check Your Competition
It’s a good idea to keep your finger on the pulse of what other brands in your industry are doing with their Facebook marketing. Not to copy them, but to get insights and inspiration for your own efforts. Your Facebook dashboard should be equipped with some type of competitor analysis data.
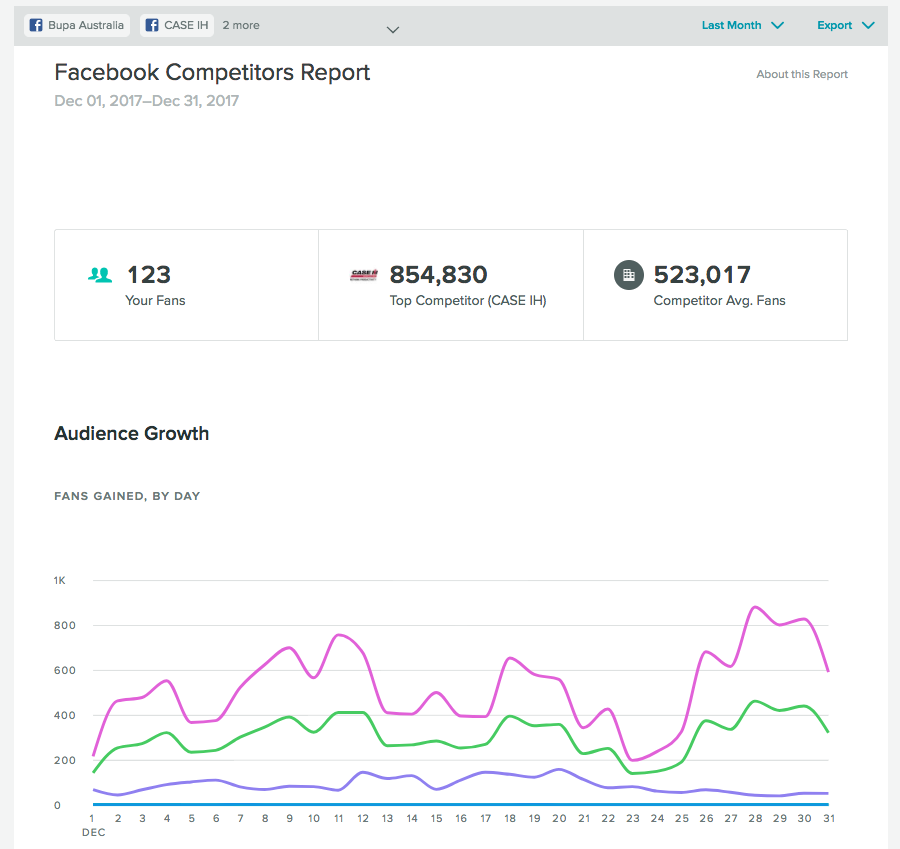
Some specific things to track are their audience growth, engagement, publishing behavior and what they’re sharing. You can gain some great takeaways from this data.
For instance, if three or four of your competitors get more engagement than you, and primarily publish videos, it could be a sign that people in your industry gravitate toward video.
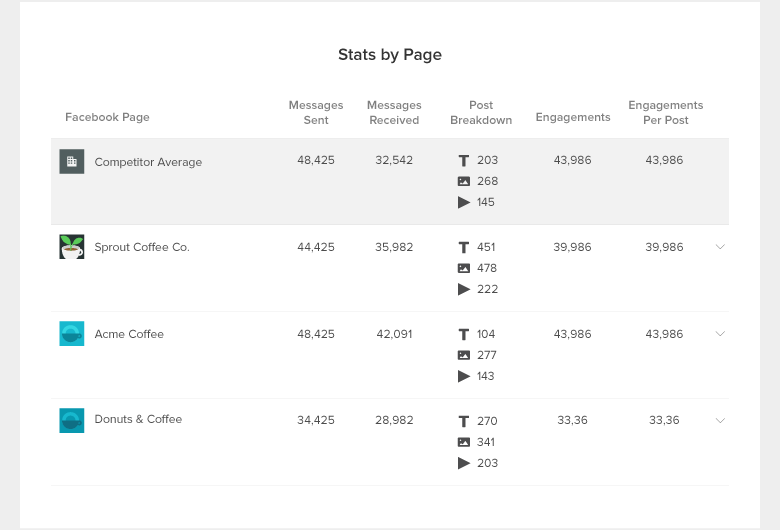
Or maybe you notice you send significantly more messages than your competitors, but still somehow get less engagement. That could be a sign that the content you’re sharing isn’t resonating with your audience for some reason, especially if you have a similar amount of followers.
Create Your Own Facebook Dashboard
With Sprout’s custom report builder, you can pull in the metrics that are most important to your brand, or your clients.

This is extremely helpful for brands with multiple Facebook profiles or agencies with several clients that care about different metrics. Pull in the metrics that you know you want to see, and then drill down into others as needed. It’ll save you a ton of time and it’s much more convenient.
The best Facebook dashboard is the one that you’ll actually use. Gathering data and looking at metrics just for the sake of doing it is useless. As a marketer, you don’t want to spend all day on reporting. Save yourself some time and use a dashboard that has everything you need built right in.
Try Sprout’s Facebook reporting tools for free with a 30 day trial!