A step-by-step guide to creating infographics to boost online engagement
We’ve all heard the saying “a picture is worth a thousand words”. With the rise and domination of visual-driven social media platforms like Instagram and Pinterest, these words have never been more true. Increasingly, content creators are turning to easy-to-consume visual content like infographics to engage and inform audiences.
For good reason, too – visual communication research suggests that images are more memorable than text and illustrations can aid understanding of text material, and studies on online behaviour reveal that posts on Facebook and Twitter featuring images produce much higher engagement than those without images.
While the value of infographics in digital marketing is clear, working with a graphic designer to create custom infographics can be both time-consuming and expensive. Fortunately, there are a ton of free tools available today that make it possible for anyone, even a non-designer, to create an infographic from scratch, quickly and easily.
To help get you started in the world of visual content creation, here’s a simple 5 step guide to creating an engaging infographic… No design skills necessary.
Download FREE Resource – Top 10 common content marketing mistakes
Grow your audience and build interest and leads by avoiding these common mistakes. With so much content being produced, it’s important your content marketing strategy cuts through. Our content marketing mistakes guide reveals the most common mistakes, but more importantly what to do about them, with strategy recommendations, examples and relevant resources identified
Access the Top 10 common content marketing mistakes
Step 1. Write brief copy with one clear message
Every great infographic starts with great copy.
What differentiates infographic copy from that of a typical blog post, eBook, or white paper is length and information density. Infographic copy must be brief, clear and concise so that key takeaways can be identified within less than five seconds.
Whether you’re repurposing existing long-form content or writing new copy from scratch for an infographic, focus messaging on a single key takeaway or important statistic. This will ensure that your infographic communicates effectively even at a glance.
The best infographics:
- Are less than 300 words in length
- Feature one key message
- Feature skimmable bulleted lists in place of paragraphs
- Replace wordy descriptions with images
Wherever possible, emphasize essential pieces of information and eliminate excess copy to ensure your infographic projects a single unmistakable message.
Step 2. Include simple data visualizations when possible
Infographics are the perfect medium for featuring simple data visualizations like bar charts, pie charts, or line graphs, to give claims some extra credibility.
If you don’t have your own original dataset to visualize, there is a wealth of public data available on the web. Here are a few of the more reputable data repositories out there:
- U.S. Government: Data on everything from agriculture, climate, and ecosystems to education, health, and public safety
- Census Data : Census data from the United States on social, economic, and health topics (extending from 1790 to 2018)
- Statista: Market research in a number of industries, ranging from media and advertising to sports and recreation
- Pew Research: Nonpartisan research on social and demographic trends, journalism, media content, and more
- American Time Use Survey: Data on American time use, featuring activities like sleeping, eating, and playing sports
- Google Trends Datastore: Google trends data curated by the Google News Lab
- Data is Plural: Topical datasets, updated weekly
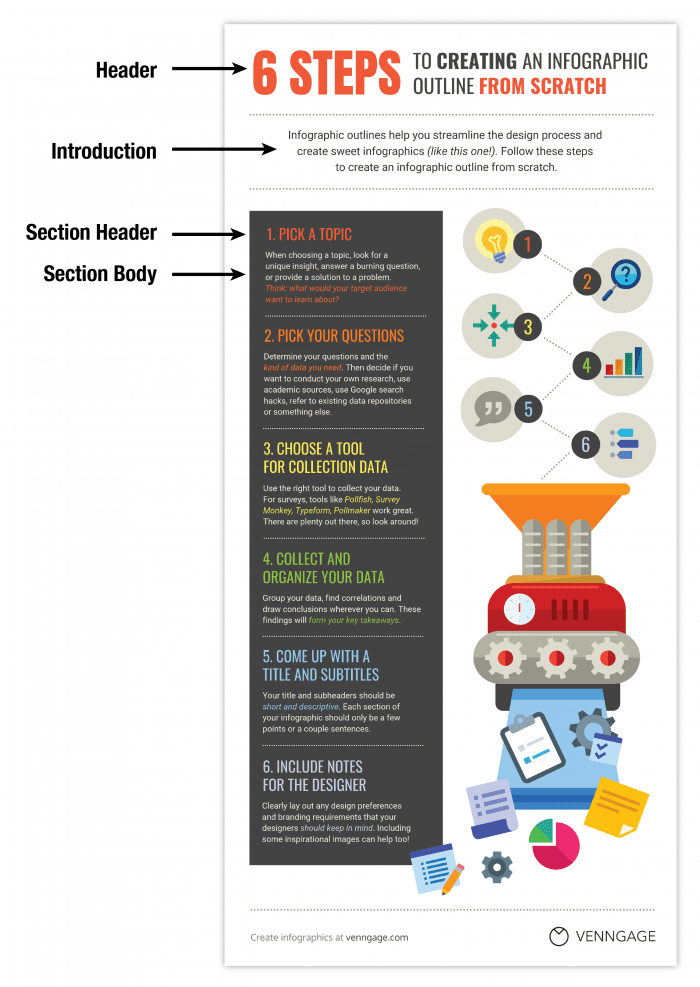
Step 3. Structure content to create an information hierarchy
Once you’ve compiled your copy and collected some supporting data, it’s important to take some time to organize this content to reflect the typical structure of an infographic.
Most infographics have:
- A catchy, descriptive header of less than 10 words
- One or two brief introductory sentences
- Main body text, divided into sections (each with its own header and body text)
Structuring your content this way is crucial for creating easy-to-digest infographics that communicate effectively at a glance.
Step 4. Pick a tried-and-true layout
With your copy nicely structured, you should be ready to start creating your infographic.
There are a wide variety of free infographic design tools at your disposal which allows you to build infographics from pre-designed templates. With these tools, you’ll just need to pick a template that aligns with your content.
The key to picking the right template is to select based on structure (i.e. layout), not based on style (i.e. colours or fonts). Focus on finding a template that fits the natural information flow of your content.
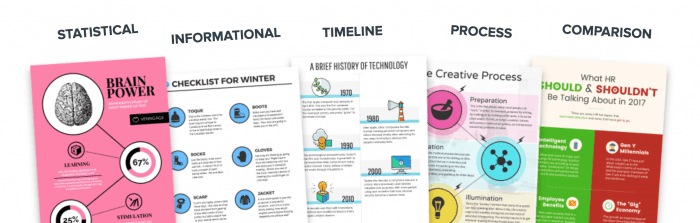
The 5 basic types of infographics, by structure, are as follows:
- Informational: Informational infographics comprise large sections and contain mostly icons and text-based content. They’re the best choice if you’re trying to educate your audience on a complex topic or when your content is particularly text-heavy.
- Process: Process infographics present content in the form of an ordered list. They are perfect for summarizing “listicles” or how-to guides.
- Statistical: Statistical infographics are best when you want to showcase a great deal of data. They typically feature a mixture of charts and use pictograms and large text to highlight important statistics.
- Comparison: Comparison infographics display two sets of information side by side. They should be used to contrast pros and cons or similarities and differences between different options.
- Timeline: Timeline infographics present events over time. They’re an appropriate choice for visualizing the history of something or depicting a process within a specific timeframe.
Once you’ve identified the best infographic layout for your content, all you need to do is replace the template’s dummy text with your own copy.
Step 5. Customize the styling with fonts, colours, icons, and images
Infographic templates come pre-styled, but you may wish to customize the template with your own personal touch. In terms of styling, there are a few design best practices to keep in mind.
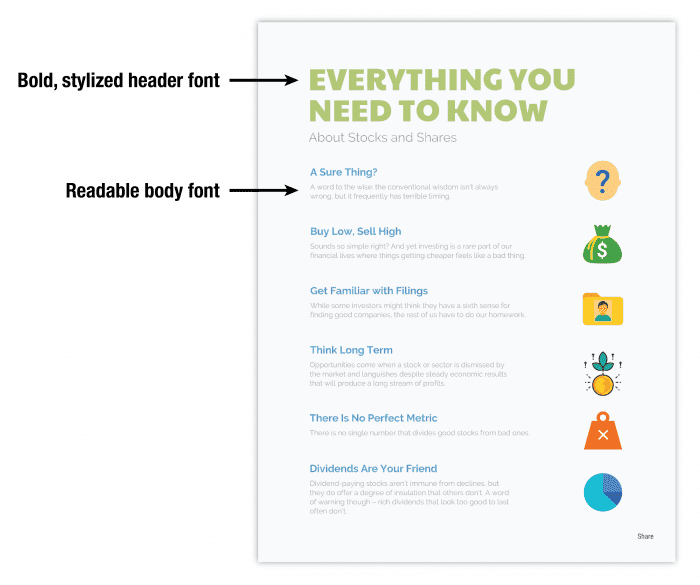
Choose a font pairing that adds style and personality
Use a maximum of two fonts per infographic: one font for headers and one font for body text. Header fonts should be stylized and eye-catching, while body fonts should be highly readable. Opt for high-contrast font pairings over low-contrast pairings.
Use a high-contrast colour scheme to draw attention to key messaging
An infographic color scheme should include no more than three colours. The brightest colours should be used to draw attention to key points, while backgrounds should remain neutral (with subtle greys or very light colours).
The following resources can help with infographic colour schemes and font pairings:
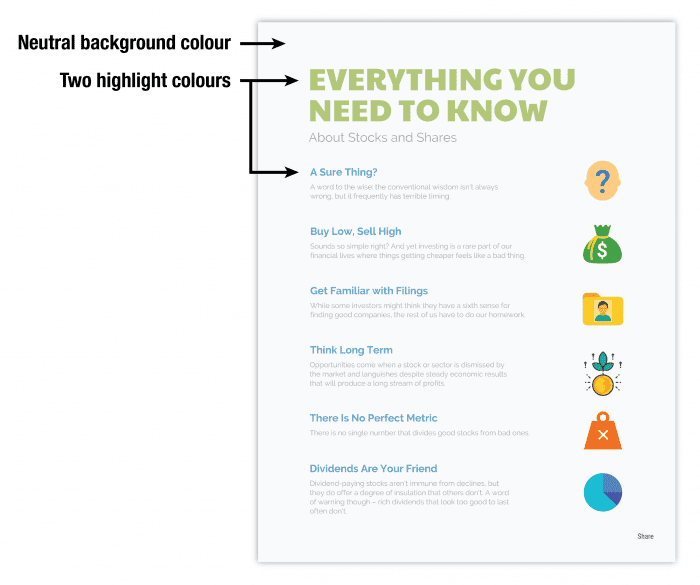
Add icons and images to reinforce important concepts in the text
Infographics often feature icons or simple illustration to draw attention to and reinforce important points within the text. Most online infographic design tools have extensive libraries of images and icons to choose from. If you can’t find what you’re looking for within the tool, Unsplash and Pixabay provide access to royalty-free images, illustrations, and vector graphics that are perfect for infographics.
Need more inspiration for infographic styling? Don’t be afraid to turn to Pinterest for design inspiration–even professional graphic designers do it.
Once you’ve customized the template to fit your personal style, all that’s left is to cite your sources (at the bottom in an 8-pt font), add your logo, and share your infographic. Post it on your website and across all of your social media channels!
![]()
Final words
As digital attention spans get shorter, we rely more and more on visual content to spark engagement. Luckily, digital content creation tools empower marketers to create high-quality visual content without the help of expensive designers.
I hope this step-by-step guide will inspire you to create your own infographic.