Chart of the Day: A survey of the effectiveness of organic and paid activities for charities including benchmarks for paid media, social media, and email marketing
This isn’t brand new research, but since I know we have a fair few members who manage digital marketing for not-for-profits and charities I thought I would share it since I’m unaware of similar benchmarks in the UK. It’s always useful to compare effectiveness and response of media with others in your sector and country. In this case, it’s a really good report based on survey response from charities based in the US, but I think it’s of wider interest.
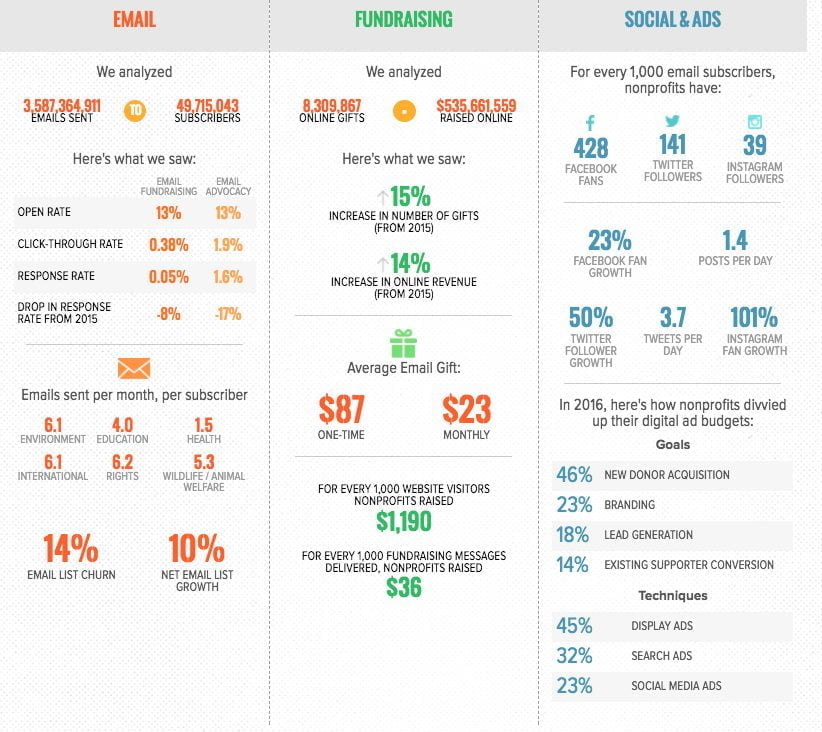
There is a great deal of analysis in this report in individual graphs for each channel and for website conversion, but here we’ll just cover the summary.
You can see that there is a useful analysis of fundraising which has a comparison based on donations per thousand visitors. This is similar to the revenue per visit figure you will see in analytics when you have Google Analytics Ecommerce tracking set up. Here you’ have to divide by 1,000.
There is also an interesting comparison of the number of Facebook fans, Instagram and Twitter followers relative to the number of email subscribers which gives a nice way to benchmark success in attracting social media advocates.
Finally, investment in paid media is compared. Surprisingly spend on display is higher than social media and search which I wouldn’t have expected.