
Statistics on Search Engine Marketing usage and adoption to inform your search engine marketing strategies and tactics
Statistics help us turn data into information, allowing us to make informed and rational decisions and that’s exactly the purpose of this article. We’re huge fans of search engine marketing, but not everyone believes in its potential for growing a business, either through Search Engine Optimisation or Paid Search Marketing – which means an AdWords focus in many countries.

Download FREE Resource – 10 business-limiting SEO mistakes
The search engine optimisation (SEO) mistakes to avoid and what to do instead. Google’s engineers have said there are at least 200 ‘ranking signals’ which affect whether you can rank above your competitors or not for searches which will bring you new business. To make SEO even more challenging, many of them change frequently in Google’s algorithm updates. So, it can be really tough knowing what matters in SEO and what doesn’t.
Access the 10 business-limiting SEO mistakes
This article is aimed at helping you make better-informed decisions about the running of your search marketing and making the business case by modelling the returns from Search Engine Marketing if you’re using a search gap analysis to put a quantitative estimate to the returns. Questions we answer in this article include:
- What is the market share of search in different search engines
- How many searches are made on Desktop vs Mobile vs Tablet?
- Google SERPs features by % of queries
- What is the Google non-brand keyword minimum bid?
- Clickthrough rates on AdWords by position
And more!
Who has the biggest search engine market share worldwide?
According to Net Market Share the global marketing share percentage, in terms of the use of Search Engines heavily favoured Google throughout 2017 – averaging a net share of 74.54%. This again reinforces the fact that Google is the market leader, however, it also highlights that the “Others” such as Yahoo, Bing and Baidu etc still hold a large audience and it would be silly to simply ignore them (averaging between 5-10% market share).
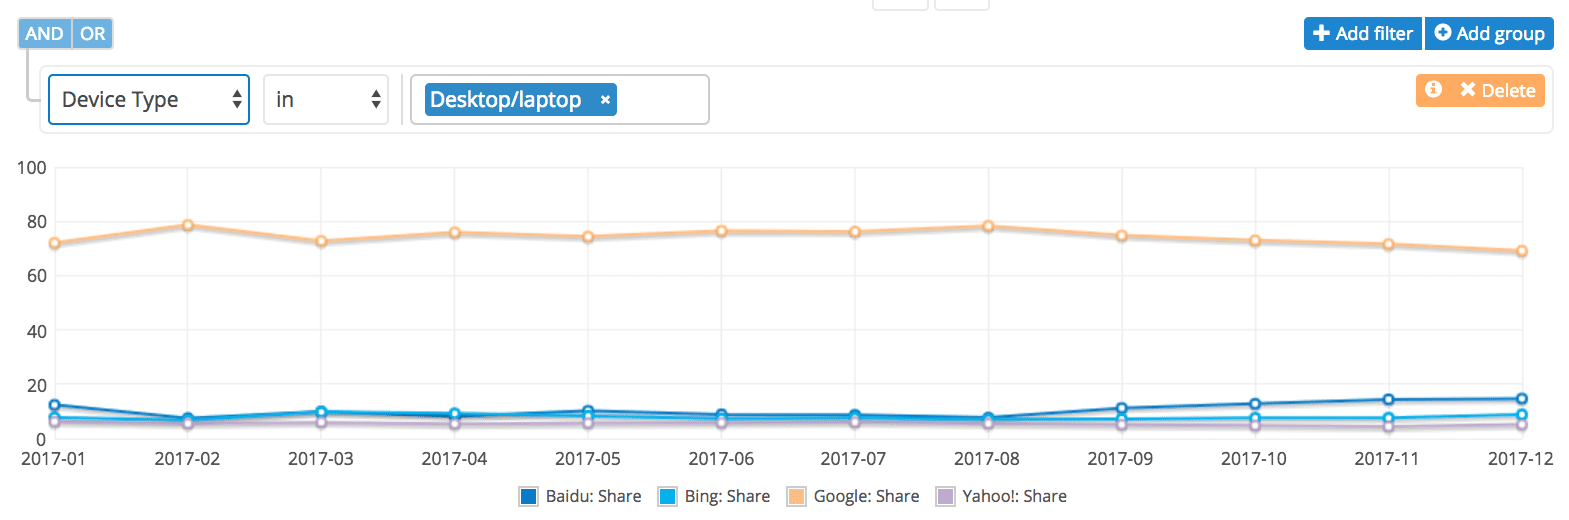
It is interesting to note that although Google holds the most market share month on month it has been slowly decreasing from August, with Badui’s share slowly rising to 14.69%. Other search engines like AOL, duckduckgo and Ask all have less than 1% market share.
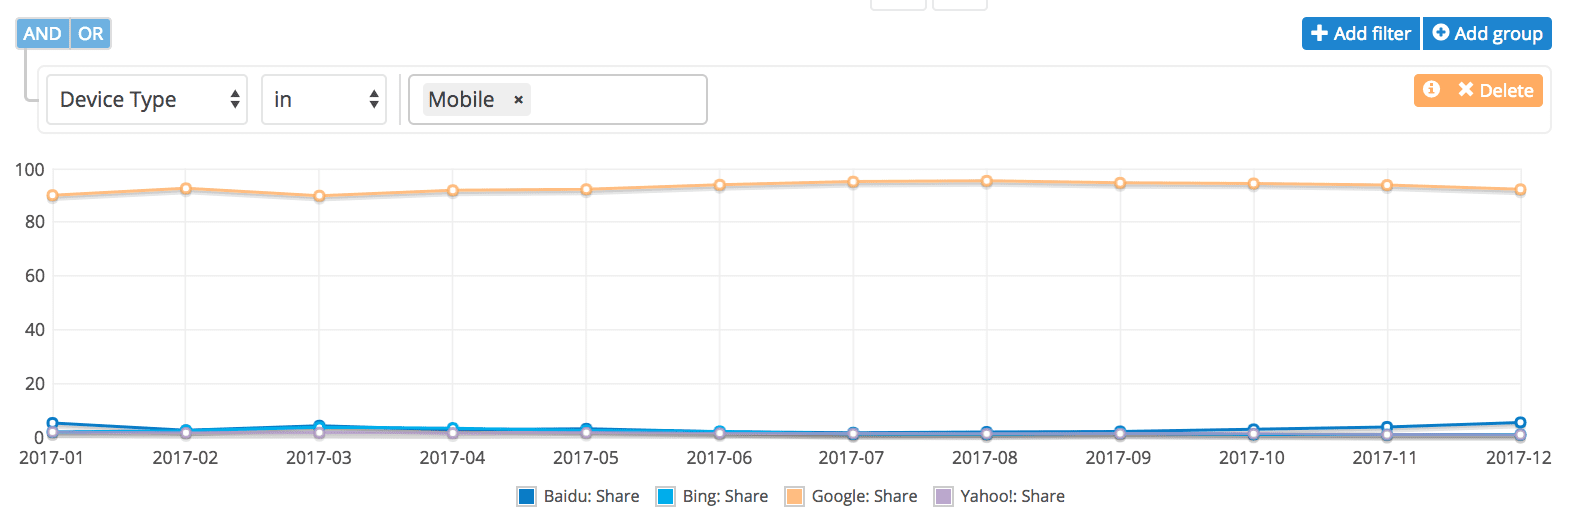
However, Google still dominated when for mobile devices holding more than 90% market share. This is not surprising considering the accessbility of Chrome on mobile devices and its changes to mobile indexing to provide higher quality search results and UX design. Badui only holds 5.44% market share with Yahoo and Bing holding less than 1% each.
How many searches are made each day?
In 2017 46.8% of the global population accessed the internet and by 2021 this figure is projected to grow to 53.7%.
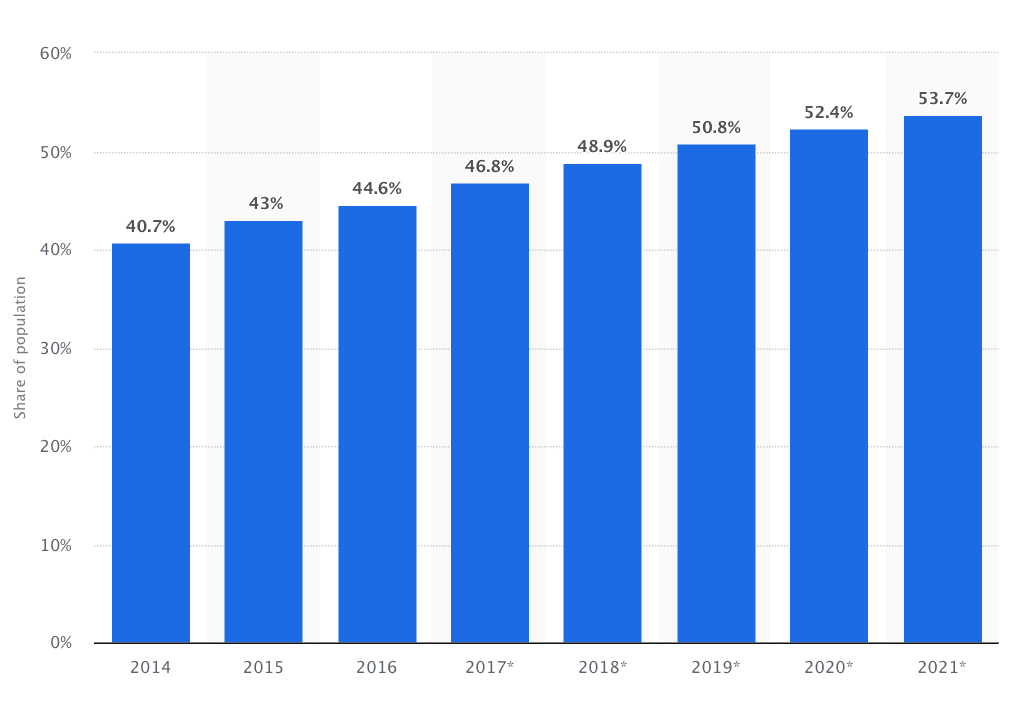
The number of people using internet search engines is increasing year on year and is almost unfathomable.
Using the above Market Share chart and the data from Internet live stats, we can see the number of daily searches on Google – 3.5 billion, which equates to 1.2 trillion searches per year worldwide.
It is interesting to note how far search engines have come – in 1999 it took Google one month to crawl and index 50 million page, however in 2012 it took less than one minute! The internet is moving at a much faster pace and it is important to keep up in order to keep your content seen.
How many searches are made on Desktop vs Mobile vs Tablet?
Knowing whether your target audience is searching via desktop or mobile is vitally important for knowing how to set out your landing pages. Responsive design is a must if you want to provide a mobile-friendly UX for users and optimize content for readability and ease of access.
Mobile and desktop searches have been fluctuating in dominance in the past year years, at one point Google announced that we had passed the tipping point whereby the number of Mobile searches had taken over that of Desktop stating…
“more Google searches take place on mobile devices than on computers in 10 countries including the US and Japan.”
BrightEdge reports that 79% of keywords overall and 47% of keywords in positions 1- 20 rank differently in search on mobile and desktop SERPs.
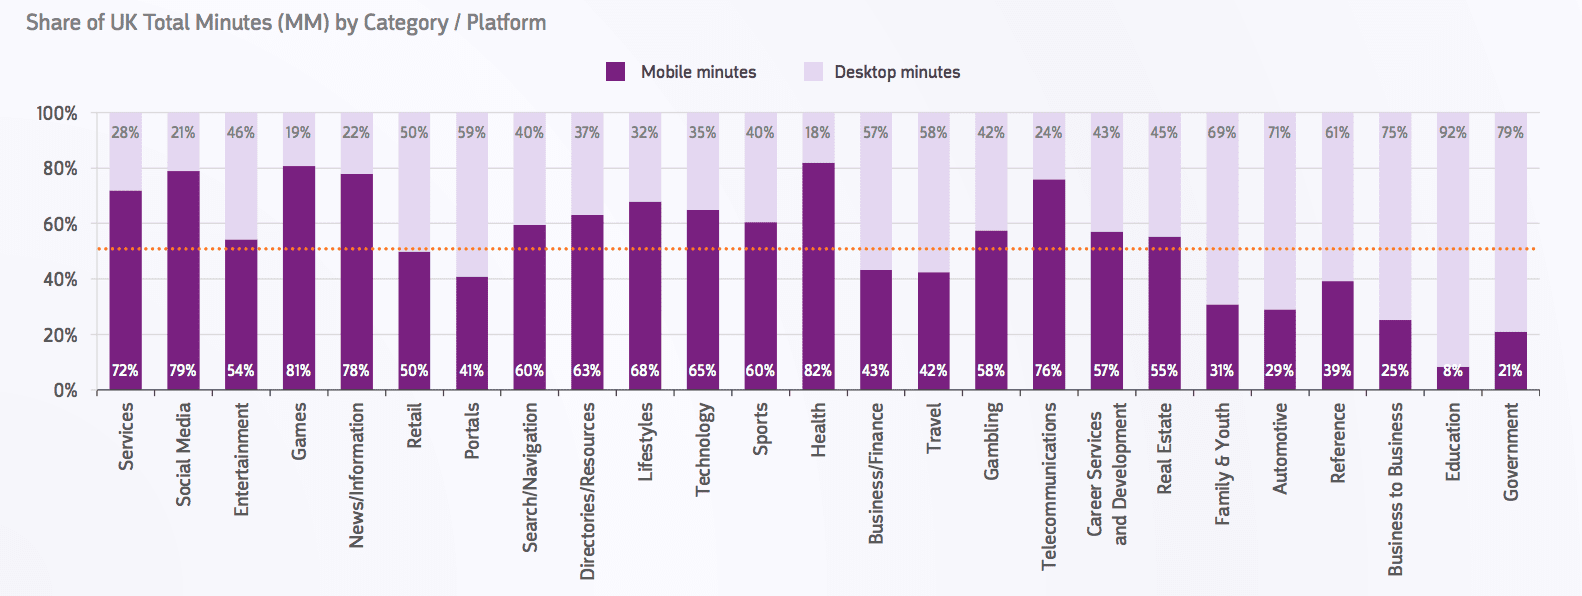
The graph below from comScore’s global mobile report shows the share of total UK minutes by industry on mobile and desktop. Health, news and media, games and social media have the largest mobile minute share in the UK, whereas travel, finance, B2B and portals have the highest desktop minutes.
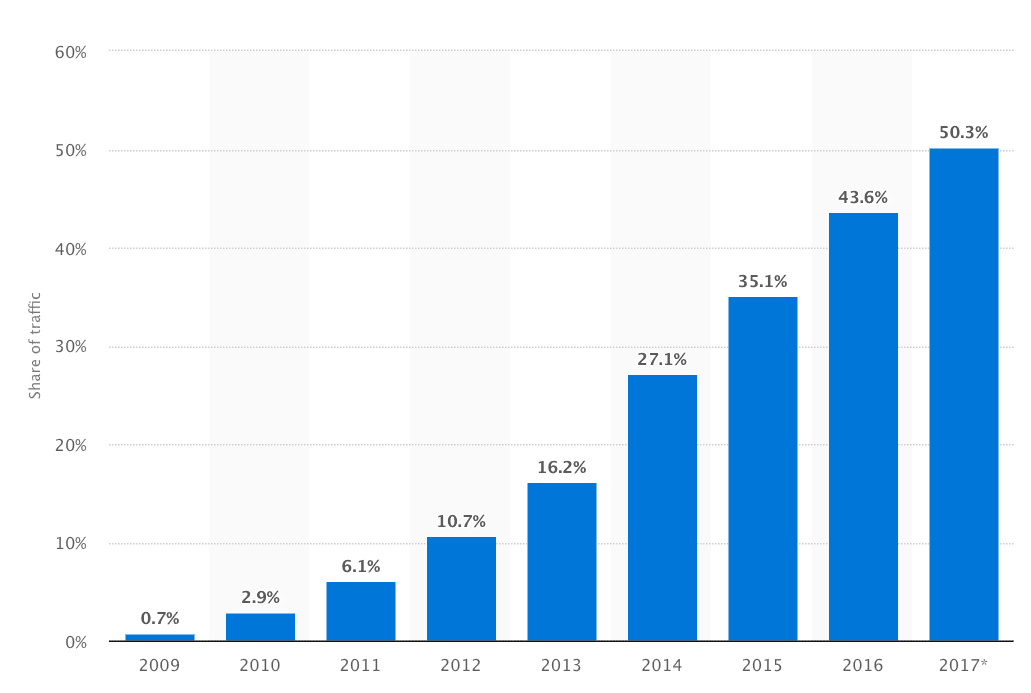
Mobile phones have been gaining website traffic year on year – in 2009 only 0.7% of web traffic worldwide was generated through mobile phones. This is probably due to the slow internet connection and the lack of mobile-friendly sites which hindered an easy user experience. However, with technological advancements and the strong growth of smartphones throughout the last 9 years, mobile internet use is much easier, quicker and accessible. In 2017 mobile accounts for 50.3% of all web traffic generated worldwide.
Google SERPs features
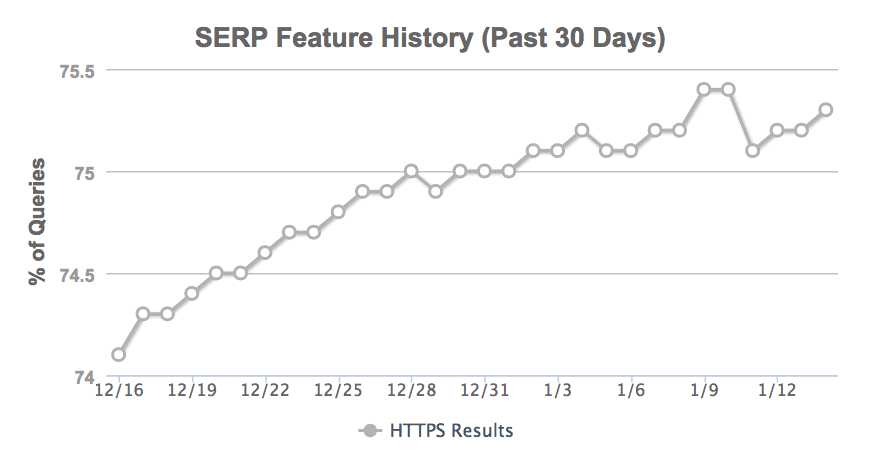
Moz have a great interactive SERP feature graph that allows you to select SERP features that are important to you and see the percentage of queries that shows that particular feature.
For example, results from HTTPS domains have gradually seen higher exposure on SERPs from roughly 74% to 75.5% within the last 30 days. Moz’s SERP feature graph is great for constantly checking changes in Google SERPs. This parallels with the increasing importance of switching sites to HTTPS – Google announced that security is an important issue to them and that sites with HTTPS would be a signal to Google ranking algorithm.
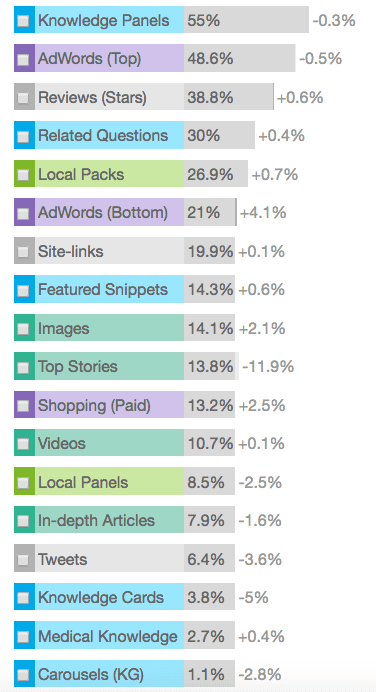
Other features that are measured include AdWords, related questions, reviews etc. AdWords that are displayed at the top of the SERPs is shown for 48.6% of queiries, verifying that businesses should focus their wider efforts on all aspects of search engine marketing and not just SEO. PPC campaigns and Google advertising is also advantageous.
Organic ranking signals that affect SERPs
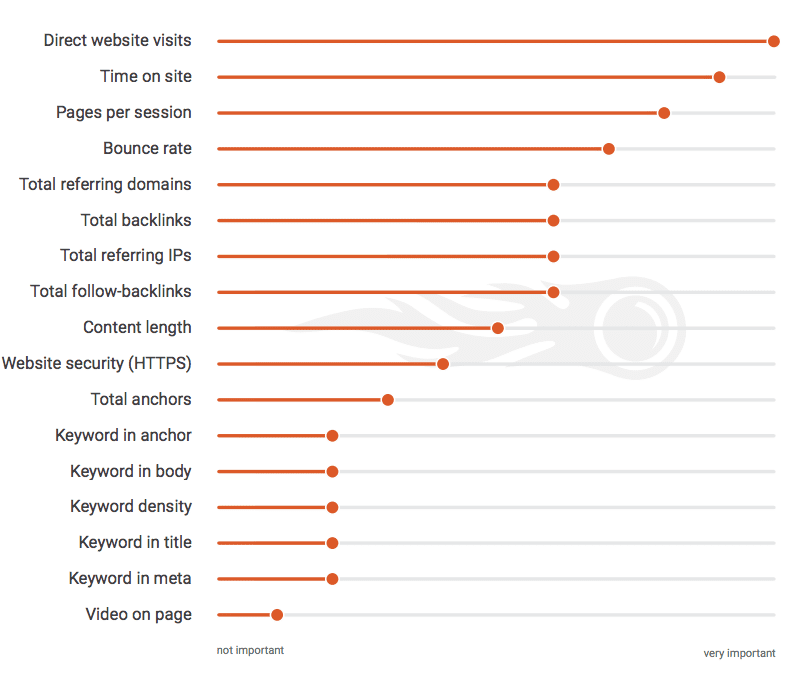
SEMrush has found that the number of direct website visits to your site will positively impact your organic SERPs position. Metrics that show higher engagement rather than what content is written on the page have a larger impact on ranking. Time on site, pages per session and bounce rate are metrics that indicate a higher quality of result to Google and therefore are prioritized higher.
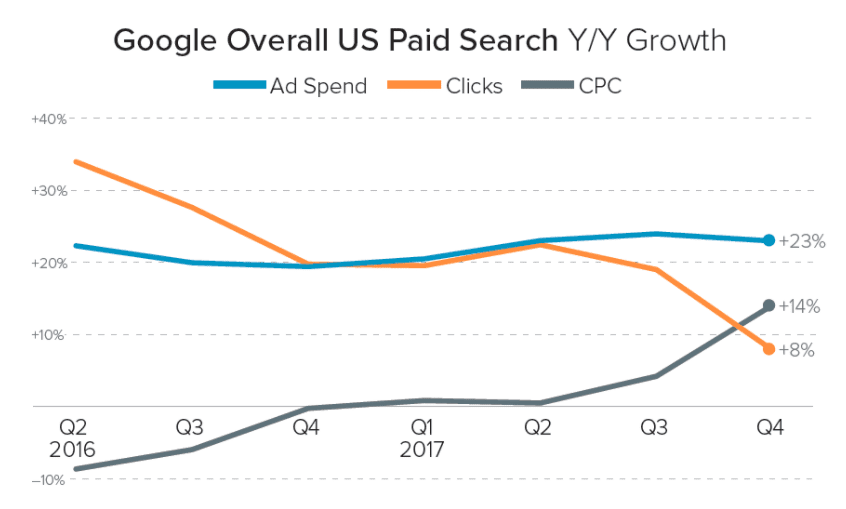
US paid search Y/Y growth
The newly released Q4 2017 Digital Marketing report by Merkle shows across all search ad platforms, spending grew 24% Y/Y in Q4 2017, up from 22% growth in Q3. Click growth slowed sharply to 9%, while CPC growth jumped to 14%.
On top of this, phones contributed to 55% of Google search ad clicks in Q4 2017 and only 37% on desktop. Bing ads had the largest desktop clicks with 77%, yet only 14% ad clicks on mobile.
Percentage click-through rate (CTR) of branded vs non-branded keywords?
Often users will know what brand they are searching for – they’ve probably seen them on other channels, social and TV etc., but do branded queries have a higher CTR than non-branded queries from users asking a question and open to the possibility of a company telling them an answer?
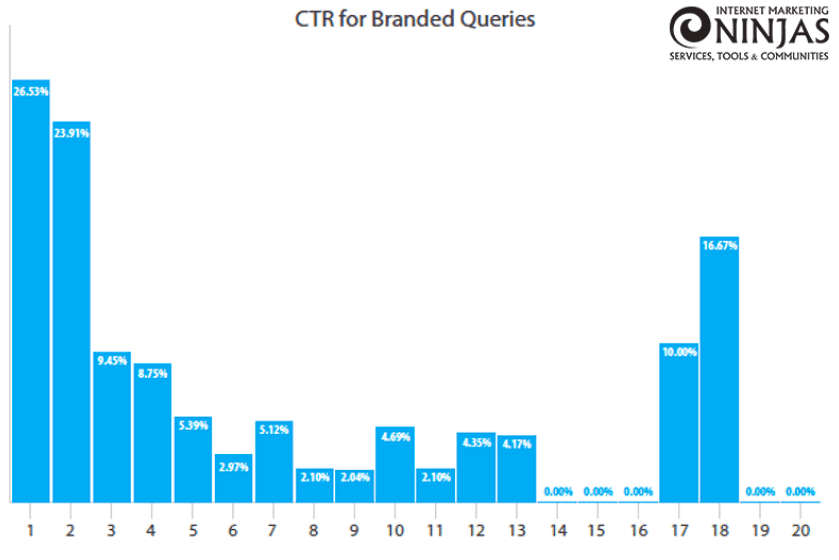
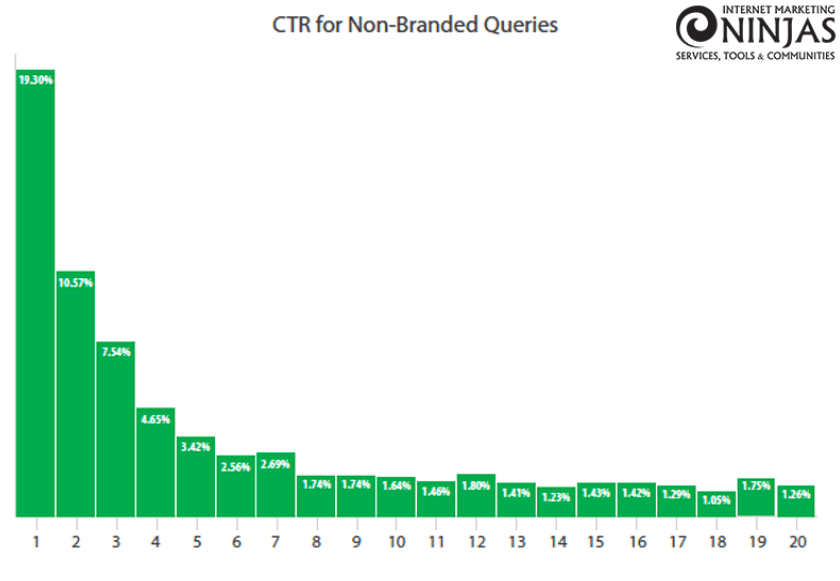
A study by Internet Marketing Ninjas found that branded queries have higher CTR on the first half of the first page of Google. Surprisingly results 17 and 18 also have a high CTR. However, non-branded queries have a steady decline in CTR. The average CTR for the first position is 19.30% whereas the second position CTR is 10.57% almost halving.
Do click through rates (CTR) decline based on position?
As of November 2017 the average CTR for results on desktop in first ranking position was higher at a CTR of 31.52%, compared to the average first ranking result on mobile at 24.05% CTR.
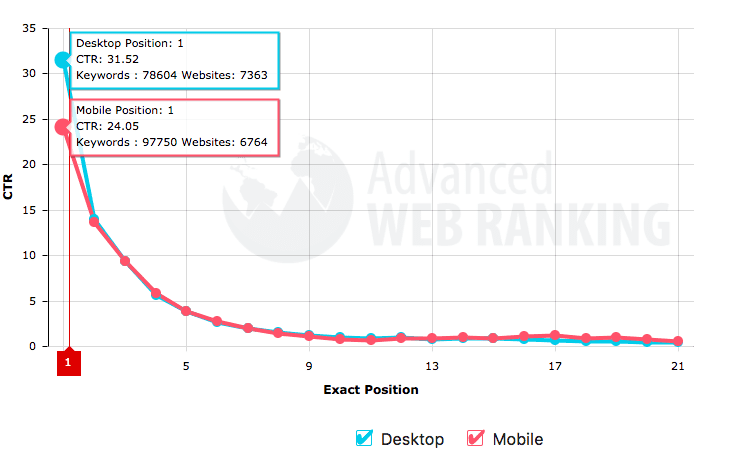
Click through rates do in fact decline the further down SERPs the result is positioned. Not only do they decline, but the difference between 1st and 5th position is the largest decrease with an average of 25%. This shows the reason for the large importance search engine marketers place on ranking first on SERPs. There is a big difference in CTRs for the 1st and 5th place. Users are less likely to scroll down for information as this requires more time – often the first couple of results are well trusted because Google has placed them higher than results that can be found on page 3.
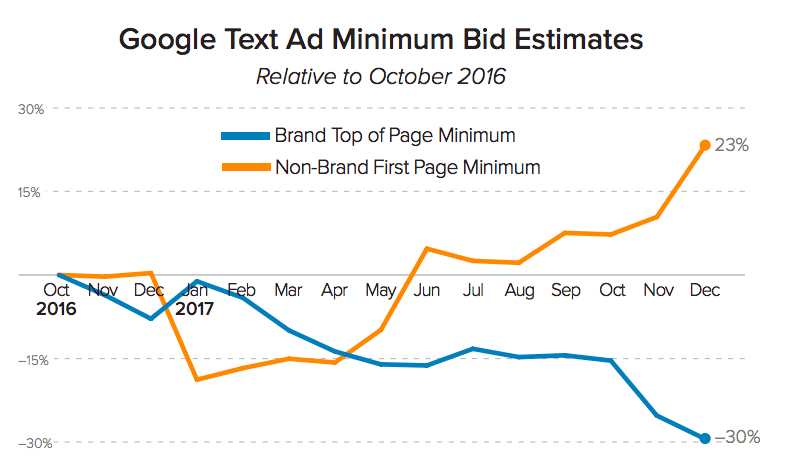
Google non-brand keyword minimum bid
Knowing how high to set your max CPC against your ad relevancy score is important in understanding the position of your ad on SERPs. The DMR shows that the minimum bid for non-brand keywords has dramatically rose as much as 23% to gain visibility on first-page. They state that:
“These estimates began to trend significantly higher in May 2017, matching the timing of a Google change to Ad Rank, and increased sharply throughout Q4 2017.”
Click through rates (CTR) for PPC per Industries
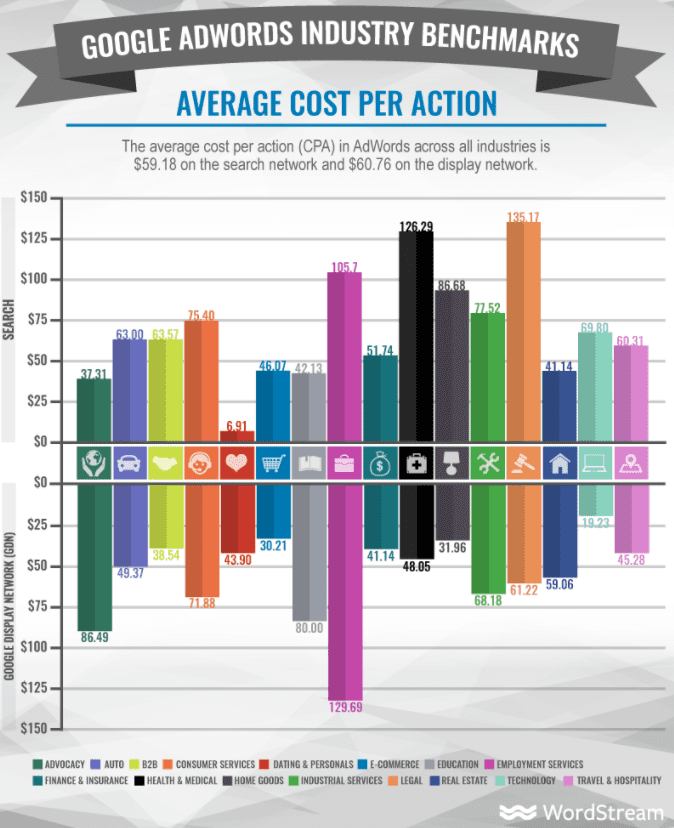
Wordstream have produced a set of infographics based on averages across AdWords metrics such as Average CTR, Cost-per-click (CPC), average conversion rate (CVR) and cost per action (CPA) across twenty industries.
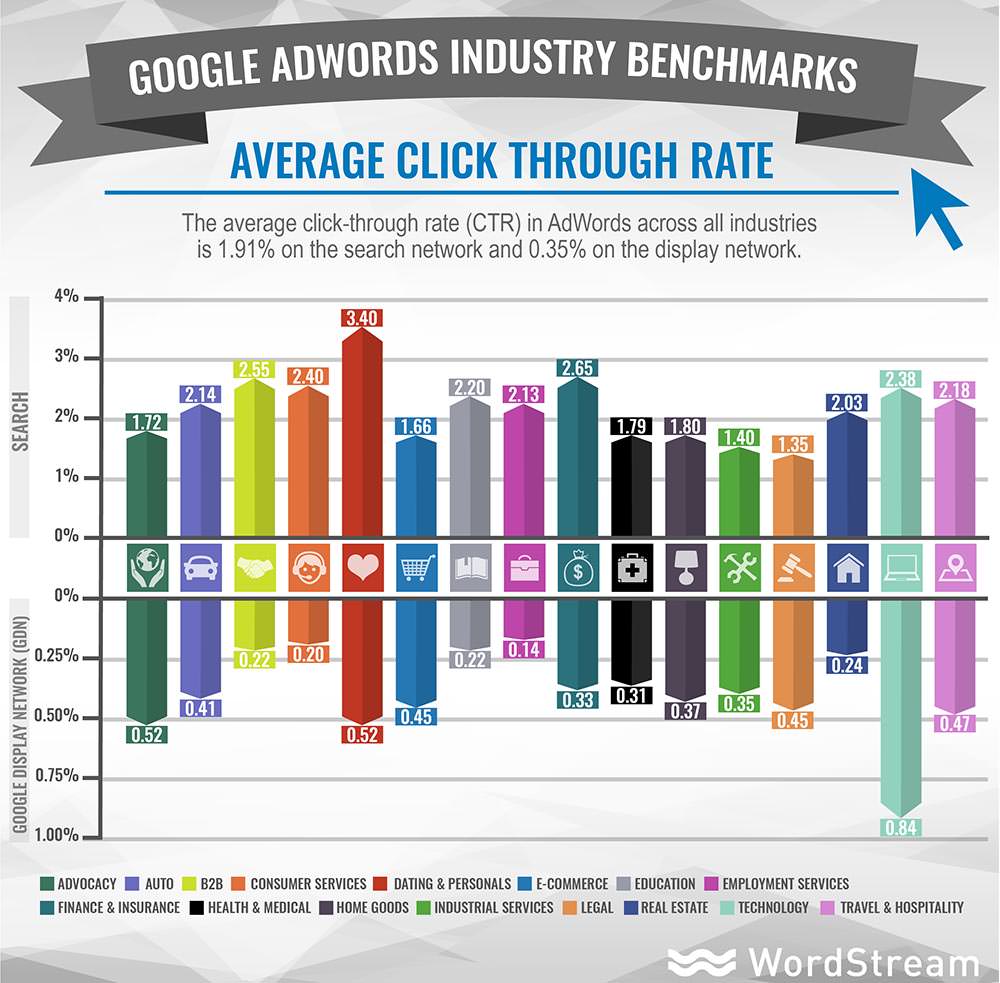
It shows the dating world is head and shoulders above the rest (3.4%), with other high-fliers including Finance (2.65%), B2B (2.55%), Consumer Services (2.40%), and Technology (2.38%).
Some of the industries flagging a little include the likes of Legal Services (1.35% CTR), eCommerce (1.66%) and industrial services (1.40%). It’s interesting to see ecommerce so low down on the CTR, however, this could be to do with the amount of competition and the sheer number of ecommerce stores set-up poorly.
The ADI discovered that the Click Through Rate (CTR) on search have increased YoY, with the top 20% pulling away from other industries, except in the financial services where they are making ground on the industries above. If you’re in finance, it’s time to get on board with PPC, there appears to be a big push with paid ads.
The next infographic produced by Wordstream gives the average conversion rate.
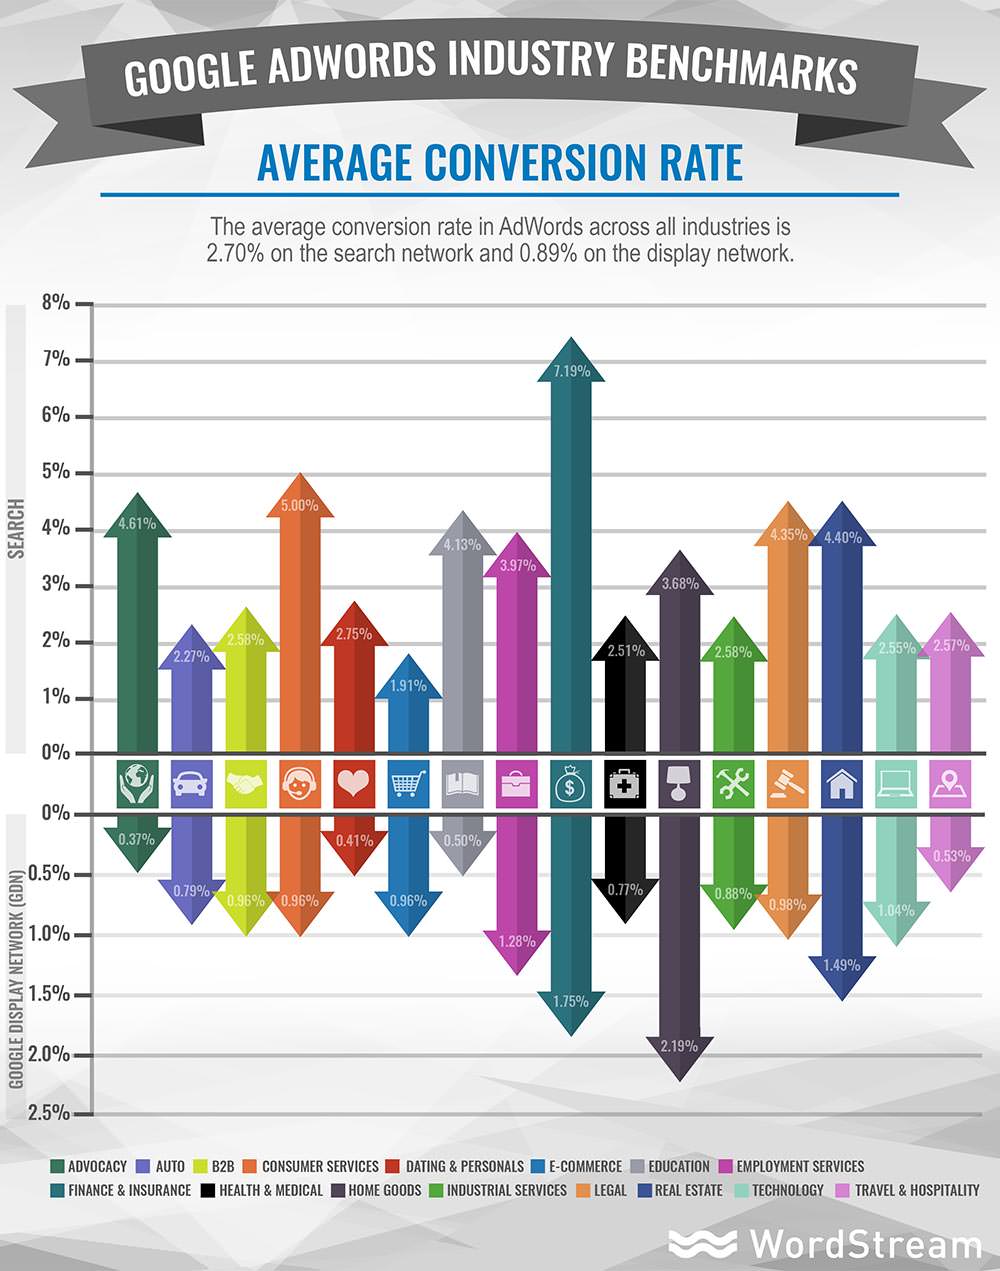
Interestingly, it’s the finance and insurance industry which converts the best, with a whopping 7.19% CVR, making sense of the sudden surge of interest in PPC in the Financial industry.
It’s interesting to note that the dating industry has the lowest average CPA on search and one of the lowest on display. Legal, medical and employment have by far the highest CPA but this is outweighed by the lifetime value of new customers/clients.
If there are any more statistics you’d like to find out, let us know by joining our member’s Facebook group or tweeting us your questions – we know all the best sources!