
Comparing growth and sources in smartphone mobile visits in the retail, travel, automotive, finance, banking, insurance and media statistics
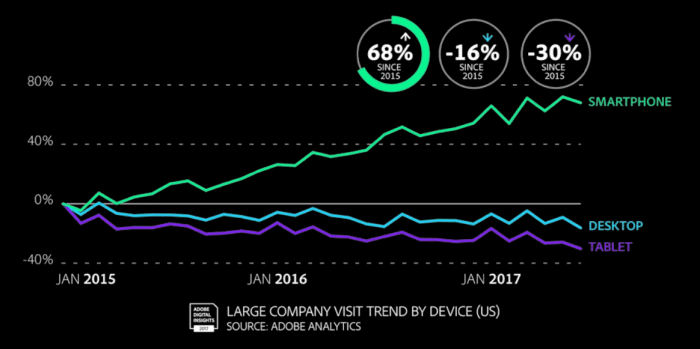
We know from trends in mobile adoption statistics that, in most industry sectors, we have passed the tipping point where smartphone mobile visits (and sales) exceed desktop visits. In this latest research from Adobe, there are useful benchmarks comparing smartphone growth by sector and the traffic sources for this. This graph showing trends in the device used to access websites and apps suggests we’re not only seeing growth in smartphone visits, but that visits from desktop and tablet are declining as smartphone effectively cannibalises these other platforms
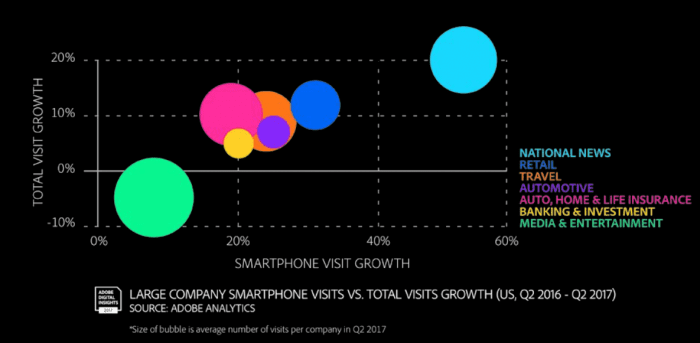
 This next chart compares growth in smartphone visits by sector shows that while overall web visits have been flat, larger companies are still seeing growth (c 8% year-on-year) in smartphone visits.
Adobe reports that
- Smartphone visit growth averages 2.5x total visit growth, indicating desktops and tablets are ‘losing ground’. I look at this instead in terms of opportunity. The main opportunity for incremental visits is now in mobile. So this suggests the need to ensure your site and, if relevant, mobile app experience and speed is of a quality to convert site visitors since we know that lead and sales conversion rates on smartphones are significantly lower .
- Industries with overall visit growth experienced strong growth in smartphone traffic to their sites compared to last year. This supports the finding of the opportunity for growth in smartphone
- National News leads at c20% growth, whereas most other industry sectors like retail, travel and automotive services are at 10% growth. Financial services total visit growth is a little lower and media and entertainment has negative figures for growth where increase in smartphone hasn’t offset declining desktop visits.
This final chart from the report shows a more detailed analysis by sector to help you benchmark if you are in one of these industries.
- Recommended source: Adobe Digital Insights Q2 2017
- Sample: Since this is Adobe Analytics data it favours large businesses. Data from large company websites and apps across seven industries within the United States. It is based on 150+ billion visits to or launches of 400 sites or apps since January 2015. Branded app information is presented separately from browser-based visits to websites. Non US data not available in this report.
- Recommended Smart Insights resources: Improving Website results guides and Quick Win guide to Increasing website leads