In 2016 more than half or 53% of small business owners said they supported then-candidate President Trump. Six months after he was elected 47% approved of the job he was doing, and the Q4 2019 CNBC/SurveyMonkey Small Business Survey has revealed it now stands at 60%; a 13% increase.
A new study of the 50 states in the U.S. from AdvisorSmith further supports these data points as it looks to determine which states grew since the 2016 election. The historic low unemployment rates along with a strong economy has increased the opportunities of small businesses across the U.S.
However, the growth hasn’t been uniform. While some states enjoyed some great numbers, others didn’t fare as well.
In order to determine the states with the strongest economic growth since the 2016 election, AdvisorSmith examined all 50 states including District of Columbia. The study includes factors such as growth rates of each state’s GDP per capita, median household income, unemployment rate, and labor force participation rates.
Each state is given a score on all the criteria and ranked based on a weighted average of their scores.
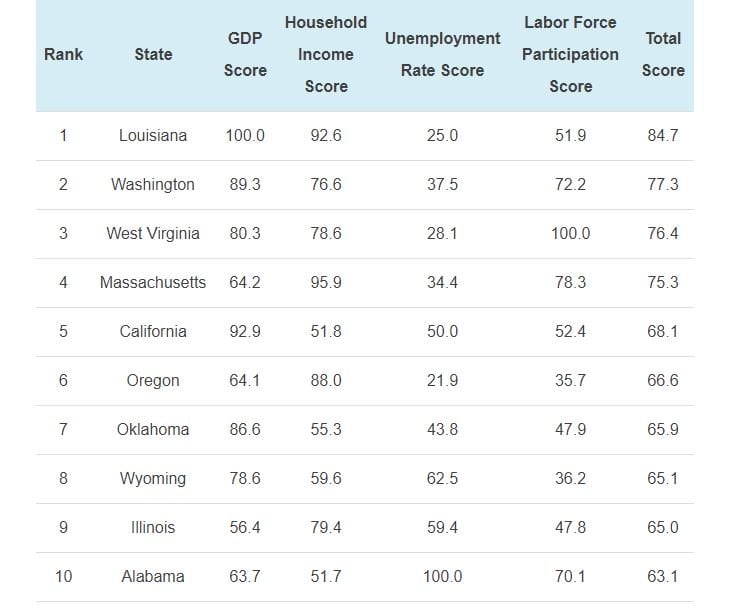
The Top State Economic Growth Since 2016 Election
With a total score of 84.7, Louisiana tops the list. The state delivered a GDP score of 100 to go along with its 92.6 score for household income. The GDP for Louisiana grew from $229.6 billion in the last quarter of 2016 to $263 billion in the second quarter of 2019.
The median household income is also impressive as it increased from $42,196 per household at the end of 2016 to $49,973 at the end of 2018. At the same time, the unemployment rate decreased from 5.3% to 4.7% during the same period.
Coming in at number two is Washington with a growth of $93.3 billion in its GDP. It went up from $503.1 billion to $596.4 billion from the fourth quarter of 2016 to the second quarter of 2019. The median household income grew from $70,310 at the end of 2016 to $79,726 at the end of 2018. And unemployment was reduced by 1%, from 5.1% in December 2016 to 4.1% in October 2019. Labor force participation also increased 1.9% from 63.3% to 65.3% during the same period.
Rounding up the top three is West Virginia with a GDP growth of $7.8 billion. The state grew from $70.5 billion in the fourth quarter of 2016 to $78.3 billion in the second quarter of 2019. The household income increased from $44,354 in 2016 to $50,573 in 2018, while unemployment decreased 0.7% from 5.2% to 4.5% through October 2019.
The states in the top ten are Massachusetts, California, Oregon, Oklahoma, Wyoming, Illinois, and Alabama.
Take a look at the top ten graph from AdvisorSmith below.

States with the Lowest Economic Growth
Even though the states with the lowest economic growth didn’t fare that well, they all increased their GDP. However, there were some that didn’t grow their median household income.
The state with the least amount of growth at number 51 was South Dakota, which grew its GDP by $3.5 billion from $49.5 billion to $53 billion over the study period. The median household income also increased, while unemployment was down from 3.3% to 2.8%.
Connecticut, Alaska, Delaware, and North Carolina took the 50th, 49th, 48th, and 47th place respectively.
Key Takeaways
Overall states are much better off since the 2016 election. In terms of GDP, there is a clear increase and unemployment rates are also lower.
If the numbers continue at this rate during the next election, states will be experiencing record numbers across these metrics over the next four years.
Image: Depositphotos.com