Knowing how to use Instagram metrics to improve your account’s performance can seem like a daunting task, especially if you’re new to the world of data and analytics.
But once you’re up to speed, Instagram metrics can be revolutionary for your growth!
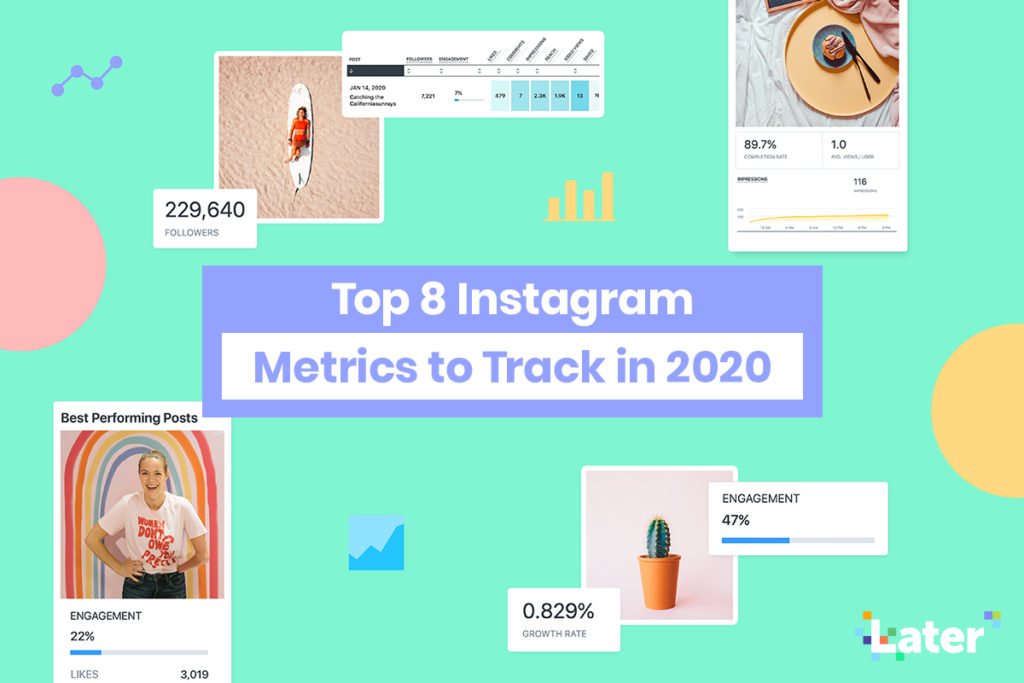
To help make it easier, we’re sharing the top 8 metrics worth tracking for a stronger Instagram strategy in 2020:

Instagram Metrics to Track #1: Reach
When it comes to monitoring your brand’s performance on Instagram, reach is now one of the most important metrics to take into account.
Whereas once upon a time everything was about engagement rates on Instagram, the removal of likes in multiple countries is changing things up — a lot!
As a result, reach is now a much more valuable and accurate metric for brands to track.
Reach shows how many unique accounts have seen your post, and therefore how much awareness and value you’re gaining.
So if your objective is to increase brand awareness and reach the highest number of users possible, you should be focusing on growing your reach on Instagram.

If a post receives higher (or lower) reach than usual, you can turn this into actionable insight for your future posts and stories.
What hashtags did you use? Was your call-to-action optimized for engagement? Did you publish when your audience was most engaged? Was there anything different about the type of content you shared that could have resulted in lower engagement?
All of these factors can have a direct impact on a post’s reach, so it’s worth taking note of any changes that could contribute to an increase or decrease in your metrics.
What’s the Difference Between Reach and Impressions?
If you’re wondering what the difference is between reach and impressions, you’re probably not alone! It’s a tricky concept to grasp.
In a nutshell, reach tracks the number of unique accounts that saw your post, while impressions tracks the overall number of times your post was displayed (even if the same person viewed it 5 times).
- Reach metric reflects the number of unique views on a post
- Impressions metric reflects the total number of views on a post

From a brand perspective, keeping tabs on your reach (rather than impressions) is the best way to track how much brand awareness each post or story delivers.
One of the easiest ways to get an overview of how your posts and stories are performing is with Later’s Instagram Analytics.

With Later’s Instagram Analytics, you can rank up to 3 months worth of Instagram posts and stories per each performance metric, so you can easily see which have performed best.
Plus, Later’s Instagram Analytics have separate “Post Performance” and “Story Performance” dashboards — so you can see exactly how each channel is driving value for your brand.
Ready to start tracking your performance more efficiently? Sign up to Later and explore the Instagram Analytics dashboard today!
Instagram Metrics to Track #2: Saves
Instagram saves are the hottest engagement metric that brands are tracking right now — especially with Instagram trialling hiding likes on the platform.
With Instagram saves, users can collect and save a post for later, simply by tapping the “bookmark” icon in the bottom right corner of an Instagram post:

These saves are a key signal for the Instagram algorithm as they indicate a strong interest in your content. The more saves you get on a post, the more people Instagram will show it to.
By tracking the number of saves your posts receive over time, you can understand what content prompts the highest number of saves and use this to inform your future strategy.
SAVE-BOOSTING TIP: Consider the type of content that your audience would be likely to save as a reference to come back to, such as motivational quotes or valuable information.
Adding a quick call-to-action to your caption reminding your audience to save your post (like Your Social Team, above) can also be a super-effective strategy.
Instagram Metrics to Track #3: Sales
Everyone may be talking about TikTok right now, but when it comes to marketing your business and actually driving sales, Instagram is definitely the better (and more sophisticated) platform to focus on.
Instagram has taken huge steps over the years to help brands to drive and track sales on the platform (introducing shoppable posts, Instagram Stories product stickers, checkout, and most recently shoppable AR filters) and it doesn’t seem to be slowing down any time soon!
To track sales from Instagram, simply add UTM parameters to any links you use.
By doing so, you’ll be able to track conversions using your chosen web analytics program (such as Google Analytics), including how much revenue you earned.
This is a great way to understand not only how much traffic your content drives, but what converts into actual sales.
If you’ve never done this before, check out our step-by-step guide here.
Instagram also has one major advantage for e-commerce brands: a clickable link in bio. The link in your bio is one of the most valuable tools for driving traffic and sales from Instagram.
With Linkin.bio by Later, you can turn your Instagram feed into a clickable landing page that’s optimized for driving and tracking sales.

And if you’re on one of Later’s Business plans, you can even tag Shopify products directly in your Linkin.bio posts.

All you need to do is connect your Shopify store to make your Linkin.bio content instantly shoppable — and fully trackable.
You’ll then be able to see all of the clicks and revenue your Linkin.bio posts generate — straight from Later’s Instagram Analytics dashboard:

Setting up a Linkin.bio is one of the easiest ways to get more value from your link in bio, while tracking every Shopify sale you drive.
Integrating Shopify to your Linkin.bio is available on all Later Business plans starting at $19/month — it only takes a few minutes to get set up!
Instagram Metrics to Track #4: Engagement Rate
As likes disappear across the world, comments are the hot new engagement metric for brands on Instagram.
Which is why it’s super important to measure your Instagram engagement rate — rather than just likes — in 2020.
Your Instagram engagement rate is a key indicator of how well your audience is responding to your content. If your followers are commenting, liking, and sharing your content, your engagement rate will show it.
So how do you calculate your engagement rate?
The verdict is still out on the definitive answer to this question as every social media manager, analysts, and analytics tool has a slightly different way of doing things. But the general consensus is that, overall, it’s related to this calculation:
Divide your total number of likes and comments by your follower count, and then multiply by 100 to give you a percentage.

But the good news is that if you use Later, your engagement rate is automatically calculated for you. So you can put down the calculator and easily get a snapshot of all your best performing content!

If you notice that your engagement rate is high, that means that a large portion of the people who follow you are actively engaging with your content — you’re on to something!
On the flip side, if your engagement rate is low, it could mean a few things. Perhaps your content isn’t resonating with your followers, or you aren’t posting at the right time.
Keeping an eye on this metric is key to long-term success, as you can pin-point exactly what resonates with your audience — and use this valuable insight to inform your future content strategy.
ENGAGEMENT TRACKING TIP: Engagement rates can often be misleading when it comes to video content, as often people will engage with a video by watching it, instead of hitting “like”. This can result in a much lower engagement rate for video content in comparison to photos. Use metrics like reach or comments for a more reliable benchmark.
Instagram Metrics to Track #5: Instagram Stories Views
One of the toughest parts of creating content for Instagram Stories is generating ideas on what will interest your audience. You want to create stories that really resonate with your followers and hold their attention from start to finish.
Once you know what kind of content has your audience hooked, you can better strategize and continue to create content that works for them.
But how can you tell what content performs best? It all comes down to your Instagram Stories metrics — and at what point you lose viewers.

To help explain how to calculate your metrics, we’re going to call every post that makes up your Instagram Stories – whether that’s a video, photo, or boomerang post – a ‘slide’.
Each slide that’s posted to Instagram will have its own individual metrics — including impressions and navigations:

When you’re posting multiple slides to Instagram Stories that are all related to the same topic, that makes up your overall story.
So now you can use the metrics for each slide to tell you how your overall story performed in a 24-hour period!
Here’s how to get a clearer picture of your audience retention rates on Instagram Stories:
- Check your completion rate for each slide: Your slide completion rate measures what percentage of viewers watch the entire length of the slide (rather than clicking away after 1 second). There’s no easy way to calculate this manually, but luckily Later’s Instagram Stories Analytics calculates it for you.
- Calculate your Instagram Stories watch through rate: This is the calculation of people who watched your story all the way through from the first slide to the last. Calculate this by taking the views stat of your first Instagram Stories slide, subtracting the views metric of your last slide, and then divide by the first slide’s views. This will give you a percentage of how many people stayed around till the very end of your story.
- Calculate drop off rate after your first slide: Your first slide in an Instagram Stories series really needs to grab your viewers’ attention, so they want to stay tuned and keep watching! To gauge how engaging that first slide is, you can calculate the percentage of people who stopped watching after just the first slide. To do this, take the views metric of the first slide, subtract the views of the second slide, and then divide by the first slide’s views!
With these calculations and percentages, you’ll have a benchmark metric to continuously improve your engagement and watch rates of your Instagram Stories.
Analyze up to 3 months’ worth of Instagram Stories data with Later’s Instagram Stories Analytics today — available on all paid plans!
Instagram Metrics to Track #6: Best Time to Post
Did you know that you could be hindering your engagement rate simply by publishing your posts at the wrong time?
Finding your best time to post is the best way to reach your audience when they are most likely to comment and like your content — rather than when they’re half asleep, or more focused on something else.
But don’t fret, Later has analyzed over 12 million Instagram posts to come up with the best times to post!

Of course, every account will be slightly different depending on your business and your audience, but it’s good to use this data as a starting point and then really focus on the best time to post for your followers.
You can do this in two ways:
Firstly, take a look at your Instagram Insights. Under the Audience tab, you’ll find a breakdown of when your followers are most active online broken down by day of the week and time of day.

Secondly, you can use your Later Analytics to hone in on your audience’s behaviors. Your Later analytics dashboard has a super-detailed breakdown of when your audience is online and you can use that info to tailor your Instagram publishing calendar.

Or you can remove the guesswork completely and use Later’s Best Time to Post feature that automatically calculates your top 7 posting times each week and highlights them in your content calendar.

Discover your best time to post by signing up to any of Later’s business plans, starting from just $19/month!
Instagram Metrics to Track #7: Growth
Keeping tabs on your profile growth has always been important, but now — thanks to Instagram’s “followed” and “unfollowed” metrics — you can see exactly how many followers you gain and lose each day.

Having this level of insight is super helpful for understanding what content helps to grow your followers, and what content results in a spate of unfollows.
For example, if you notice a spike in unfollow activity after sharing a feed post, it could be a strong indication that the post was a miss with your audience — and something to take note of in your future content plan.
That being said, it’s worth not getting too hung up on your follower count. Followers can fluctuate due to a number of reasons, and ultimately, having a smaller but more engaged audience is often more valuable.
An engaged audience is much more likely to rep your brand, purchase your products, give useful feedback, and share posts with their friends and family.
Want to increase your engagement levels in 2020? Discover 11 Ways to Increase Instagram Engagement in 2020!
Instagram Metrics to Track #8: Traffic
There are so many ways to drive traffic to your website from Instagram, but how do you know which tactics are working the best for your business?
With Later, you can track website clicks for up to 3 months — so you can see exactly when your audience engaged with your content and clicked your website link.

If you have over 10K followers on Instagram, you’re one of the lucky accounts that can add direct links to stories.
This is a super powerful way to drive traffic from Instagram, and also opens up a huge opportunity to understand what content motivates your audience to “swipe up.”
Tip: Create trackable links for your Instagram Stories to monitor traffic and sales from Instagram!
Creating trackable links is a great way to keep your analytics separated (and organized), to help you determine exactly where your traffic is coming from.
If you don’t have Instagram Stories links just yet, you can use Linkin.bio by Later to help drive as much traffic as possible from your Instagram account.
And the great news is, with Linkin.bio you can see exactly how much traffic each individual post is driving for your brand.
We’ve integrated Linkin.bio traffic analytics into our overall post performance analytics, allowing you to track clicks at a glance, get detailed data on clicks over time, and even rank your Instagram posts by how much traffic they drove.

With this level of insight, you can see exactly what drives your audience to click your link in bio, and what doesn’t.
By understanding what motivates your audience, you can tailor your future content plan around this — and start capitalizing on those big click opportunities!
Jumping into the deep end of Instagram analytics is definitely worth it if you want to grow your account and reach new audiences.
But if you’re finding it overwhelming, just focus on these top 8 Instagram metrics to track this year and see how your Instagram strategy improves!
Ready to start improving your Instagram performance with analytics? Sign up to Later today and explore the Instagram Analytics dashboard!