
With the rise of technology like Big Data, AI, and data analytics, marketing has been on a constant path of change. These days, marketing campaigns can use various measured activities to plan campaigns, and one of these tactics is using predictive analytics for better marketing performance, higher ROI and, ultimately, faster success.
In this article, we’ll discuss what predictive analytics is, why businesses need it, what should be measured, and how to implement it for optimized business decisions.
What Is Predictive Analytics?
Although human beings have been storing large amounts of data for as long as there was data to store, the term “big data” was first used in 1997. Today something like 2.5 quintillion bytes of data are being created per day, so we’d better make good use of it.

Think of it this way: using available data for planning, designing, and deploying marketing campaign is like having a superhero cape that almost guarantees better results. Click To Tweet
Predictive analytics is a branch of advanced analytics that is utilized to predict future events or results. It integrates various techniques from data mining, statistics, modeling, machine learning, and artificial intelligence (AI) to process and analyze various data sets for the purpose of developing predictions.
In other words, predictive analytics analyzes patterns based on historical and transactional data that can be processed further for identifying future risks and opportunities.
The steps in the predictive analytics process are:
- defining outcomes
- data collection
- data analysis
- statistics
- modeling
- deployment
- and model monitoring
Quick definitions of business analytics:
- Descriptive analytics is the first stage of business analytics in which you look at historical data and performance.
- Predictive analytics is the second stage of business analytics in which past data is used with algorithms to predict a future outcome.
- Prescriptive analytics is the third stage of business analytics in which you determine the best course of action.
Use Cases: Why Do Businesses Need It?
Once the whole process has been completed, prescriptive analytics can be applied to various functions.
Here are 8 of the most popular use cases for optimized predictive analytics in marketing:
1. Detailed Lead Scoring
With lead scoring, marketing and sales divisions would be able to collaborate in a more meaningful way, since every lead is different. With prescriptive analytics, every lead will be scored based on its readiness to purchase, thus lead nurturing can be performed accordingly.
2. Lead Segmentation for Campaign Nurturing
Lead nurturing, which belongs to the early stage of the buying process, requires planning and strategizing. Using demographic and behavioral data, lead nurturing campaigns can be tailored specifically to move the process further down the sales funnel.
Related Content: How to Create a Marketing Funnel that Generates Sales (Templates Included)
3. Targeted Content Distribution
Which types of content work better for certain leads can be answered with predictive analytics. By having tailored content distribution, leads would be receiving higher-quality communication with the organization. This, in turn, would increase the probability of sales conversion.
4. Lifetime Value Prediction
Customer Lifetime Value is the true measure of marketing ROI. Click To Tweet
With predictive analytics, the historical data of each customer can be tracked back right from the beginning. This would translate to a more accurate ROI.
5. Churn Rate Prediction
Churn Rate is the rate of attrition, which is the percentage of subscribers or users who stop their subscriptions within a certain period. To grow, a business must have a higher growth rate than churn rate. With predictive analytics, you can identify the warning signs and, thus, can provide the necessary follow-up or nurturing.
6. Upselling and Cross-Selling Readiness
Using the available data, businesses can upsell, cross-sell, and combine both to increase the bottom line. Furthermore, Customer Lifetime Value can be predicted from the patterns of a customer’s buying behavior.
7. Understanding Product Fit
Equipped with historical, sales, and leads data, businesses can better understand exactly what customers’ needs and wants are, which is key to developing better future products.
8. Optimization of Marketing Campaigns
With the available data, businesses can better plan, develop, strategize, and implement future marketing campaigns. The next version is likely to improve the overall marketing performance with the help of excellent data analysis.
By applying predictive analytics in organizations, risks can be significantly reduced because decisions will be made based on data, not merely unproven assumptions that rely on instincts and some educated guesses. Many successful e-commerce ventures adopt predictive analytics in their marketing efforts and, of course, it should be no surprise that Amazon and Target are known for their best practices in predictive analytics.
Measurements and Metrics
When we’re talking about measurement, we’re talking about metrics. In this analytics era, you need to distinguish between two types of metrics: business or marketing metrics and analytics metrics.
Google Analytics metrics, for instance, is analytics metrics. “Analytics” itself means the process of examining data sets in order to draw conclusions. Therefore, “analytics metrics” is the method of measuring data sets that are examined for various purposes.
Google Analytics metrics include: sessions, page views, bounce rate, traffic sources, exit pages, goals, interactions per visit, social overview, and acquisition overview. Each metric can be further categorized based on dimensions, which include device types, regions, languages, and browsers.
Once you’ve recorded these data sets, you need to analyze them using marketing metrics before you can make business decisions.
Learn More: How to Use Big Data Analytics to Grow Your Marketing ROI
There are 6 metrics that are typically used in calculating marketing performance and ROI:
1. CAC or Customer Acquisition Cost
CAC is calculated based on the total sales and marketing cost divided by the number of new customers within a certain time period. You can create two types of CACs: the 100% online CAC and the combination of online and offline CAC.
2. Marketing Percentage of CAC
What’s the percentage of the CAC that pertains to marketing cost? To come up with the ratio, the total marketing cost is divided by sales and marketing cost.
3. Ratio of LTV and CAC (LTV : CAC)
You’ll get the ratio by dividing the Life-Time Value (LTV), or Customer Lifetime Value, by CAC.
4. Time to Earn Back CAC
Figure out the total time (weeks, months, quarters, or years) of the time needed to earn back the CAC.
5. Marketing Originated Customer Percentage
After dividing the total number of customers in a month with the total number of new customers, you’ll get the Marketing Originated Customer Percentage.
6. Marketing Influenced Customer Percentage
To find this figure, the new customers total is divided by the total number of customers who actually interact with marketing activities.
These six marketing metrics provide a foundation for cluster modeling and scoring categories. In other words, by understanding these business metrics, the analytics metrics can be properly designed to provide the required data sets.
Implementing Predictive Analytics for Optimized Business Decisions
Using metrics based on marketing goals allow you to translate them into a marketing model that truly works in the implementation phase. Before executing it, make sure to identify the existing marketing analytics and their figures. These past results would serve as the “before” picture, which you can compare with the “after” picture by using predictive analytics performance.
The cycle of marketing predictive analytics starts with data access, data exploration, modeling, and implementation of marketing campaign. The modeling phase is the next stage in the process, after understanding the metrics and the available data. Metrics and data wouldn’t mean much if there was no useable model.
For instance, there are three primary classes of predictive models:
- Cluster Models
- Propensity Models
- Collaborative Filtering
Cluster modeling is used for customer segmentations targeting demographics and personas using behavioral clustering, product-based clustering, and brand-based clustering.
Propensity modeling is utilized to predict customer behaviors based on predictive lifetime value, likelihood of engagement, propensity to unsubscribe, propensity to convert, propensity to buy, and propensity to churn.
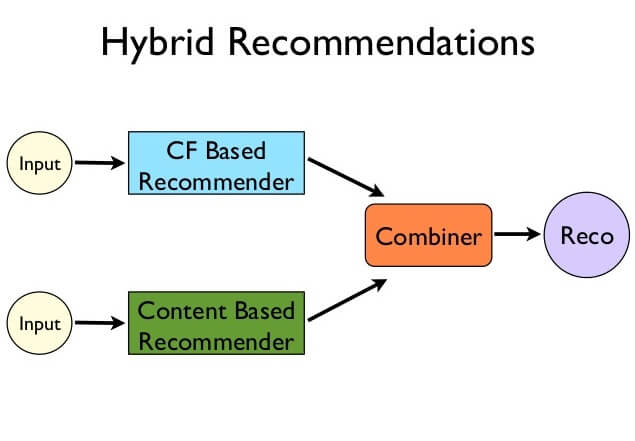
Collaborative filtering is primarily used for recommending products, services, and advertisements based on past variables, including buying behaviors. This filtering is common for upselling, cross-selling, and next-selling.
In predictive analytics, regression analysis plays a major role. A business analyst can recognize the correlations between the customer and their purchases by using “regression coefficients.” With this, they can create a score that can be used to predict the possibility of future purchases.
Related Content: Buyer’s Journey 101: What Your Email Data Says About Your Customers
According to Forrester Research, the three scoring categories that marketers use are:
- Predictive Scoring – In which prospects, leads, and accounts are prioritized based on their likelihood of purchasing action.
- Identification Models – In which prospects are identified and acquired based on similarities with existing customers’ variables.
- Automated Segmentation – In which leads are segmented for custom and personalized contents.
Conclusion
Predictive analytics is key to successful marketing campaigns. It integrates the correlation between metrics and better business results with advanced strategies to bring more impact across the customer life cycle.
Predictive analytics does, however, require strong understanding of “before” marketing analytics metrics to serve as the foundation for modeling frameworks and scoring categories. After analyzing the historical and behavioral data sets and their models, you’ll be able to use them in comparison to the “before” data.
Overall, predictive analytics allows you to make marketing campaign and other business decisions in a more informed manner. But as with other parts of life, predictive analytics doesn’t guarantee success. It merely increases the likelihood of success.